
Fig. 6.
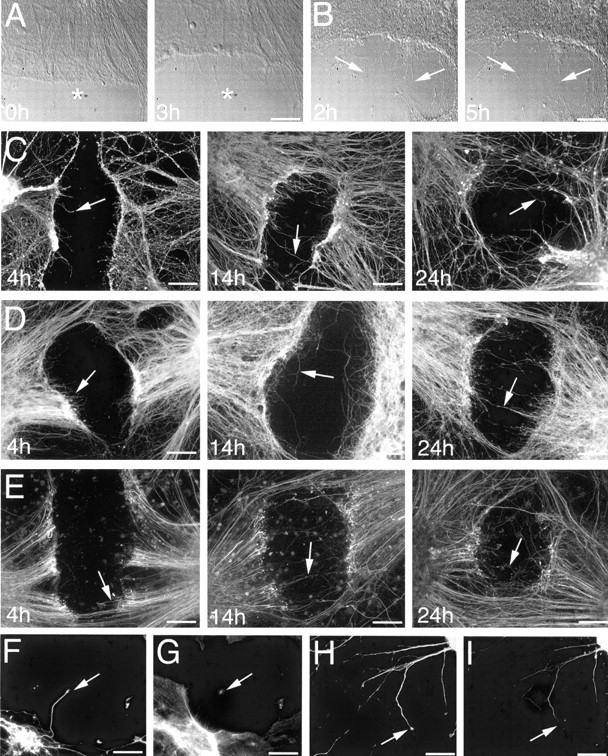
Time course of the posttransection response.A, Time-lapse imaging of a cut site immediately after injury, demonstrating retraction away from the injury site (note retraction in relation to the asterisk in each image).B, Time-lapse imaging of a cut site imaged from 2 hr after injury, with sprout growth indicated by arrows at each time point. Time course of postinjury axonal sprouting in cultures immunofluorescence labeled for βIII-tubulin (C), tau (D), and phosphorylated neurofilaments (E). Arrows in each image depict examples of sprouts. By 24 hr after injury, sprouting was extensive and several sprouts had crossed the lesion sites. Times shown on each image indicate postinjury interval in hours. Double labeling for βIII-tubulin and F-actin (F, G, respectively), as well as tau and phosphorylated neurofilaments (H, I, respectively), demonstrated that βIII-tubulin and tau were distributed throughout postinjury sprouts and proximal growth cones, whereas F-actin was most abundant in sprout growth cones and phosphorylated neurofilament were restricted to sprout shafts. Scale bars: A, B, 40 μm;C–E, 60 μm; F–I, 30 μm.