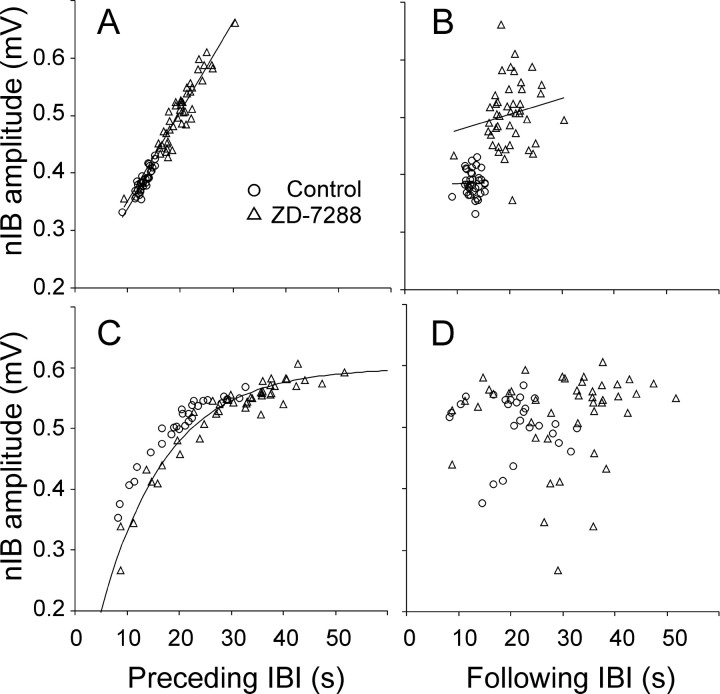
Fig. 5.
Amplitudes of nIBs were strongly correlated with the preceding but not the following interburst intervals. Illustrated data were recorded before (circles) and after (triangles) adding ZD-7288 to a P2 slice (A, B) and a P4 slice (C, D). In A andB, data points in control and in ZD-7288 were fitted separately with linear regression lines, illustrating a strong correlation in A(r2 = 0.80 andr2 = 0.87, respectively) but lack of correlation in B(r2 = 5 × 10⁻⁵ and r2= 0.03, respectively). Note that the two regression lines inA nearly coincide. In C, data points in ZD-7288 were fitted by a decaying exponential with an asymptote of 0.6 mV and a time constant of 12.5 sec; note that data points in control ACSF fall along nearly the same curve

