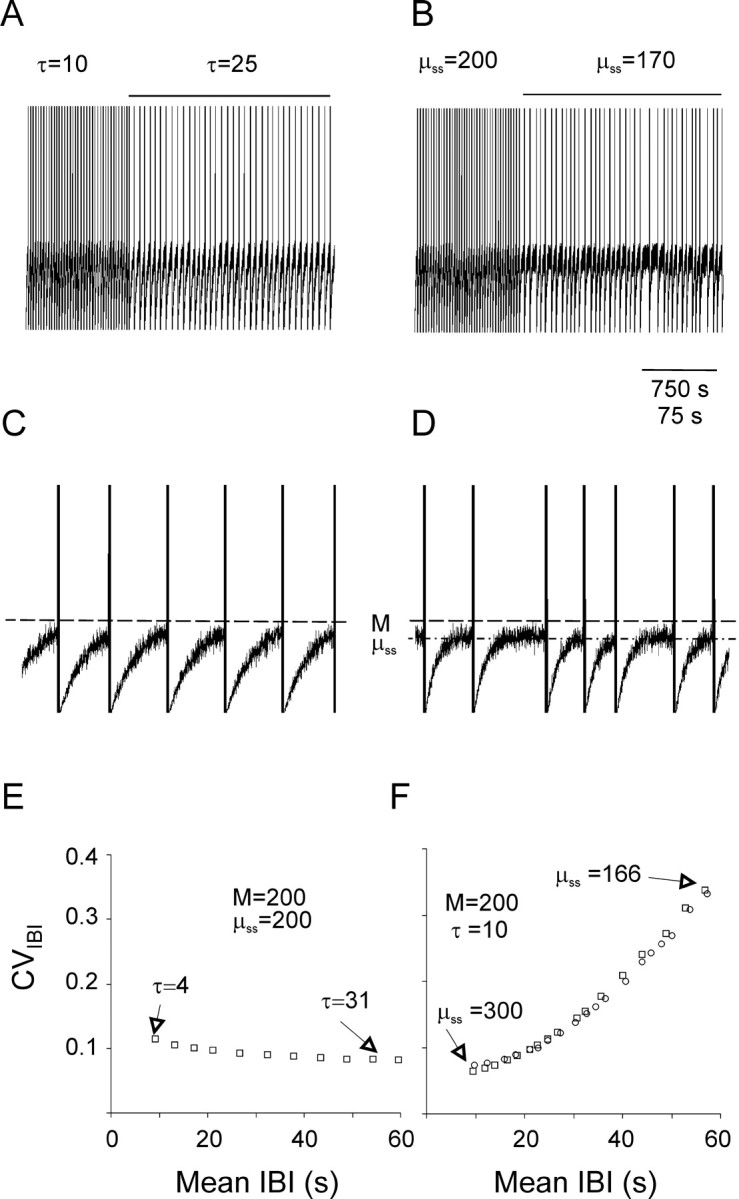
Fig. 6.

A three-parameter computational model simulated the effect of ZD-7288 on nIB frequency and regularity.A–D, Simulated sequences of nIBs are plotted at a slow (A, B) and a 10-fold faster (C, D) time base. Simulated nIBs were generated by assuming that the mean instantaneous sEPSP rate (μ) is reset to 0 after each burst and then relaxes exponentially to an asymptote (μss) with a time constant τ. Fluctuations around μ were generated by a Poissonian random-number generator; each time a fluctuation crossed the thresholdM (dashed line in C andD), a burst was assumed to be triggered. InA and B, the initial part of the trace was computed using the values M = μss = 200 and τ = 10 sec; during the time indicated by the horizontal lines above the trace, either τ (A, C) or μss(B, D) were changed to the values indicated (μss is also indicated by the dashed-dotted line in D). The traces represent the value of μ, except that the occurrence of a burst is indicated by a vertical line of arbitrary height. Note that increasing τ (A,C) reduced the frequency of bursts without affecting their regularity, whereas reducing μss (B,D) affected both the frequency and the regularity of the bursts. E, The simulated CVIBI versus the simulated mean IBI, computed using the indicated values ofM and μss while varying the value of τ as indicated. Note that changing τ had very little effect on the CVIBI. F, The simulated CVIBIversus the simulated mean IBI, computed using the indicated values ofM and τ while varying μss as indicated (squares). Note that changing μss affected in parallel both the mean IBI and the CVIBI. Changing Mfrom 140 to 238 while keeping μss = 200 generated data points (circles) that fell along the same curve generated by changing μss while keeping Mconstant.
