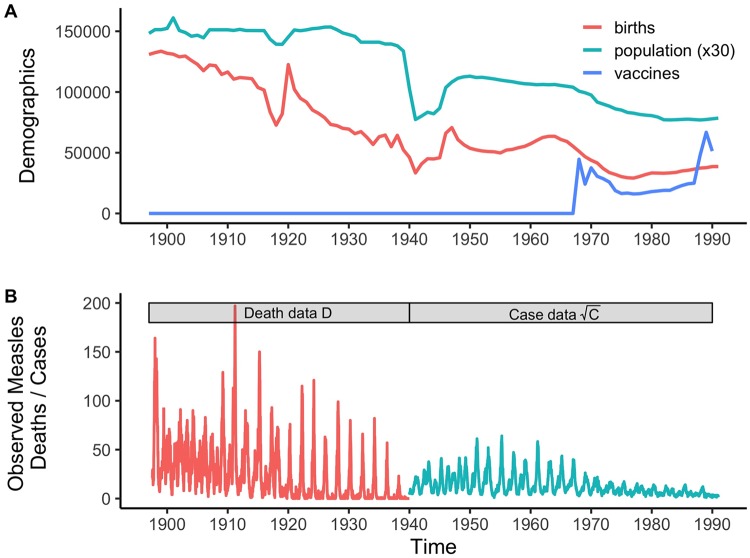
Fig 1. The demographic, vaccination, and measles data analyzed.
A) The observed population dynamics shown on a yearly scale. The major demographic fluctuations to births (red) and population counts (green) caused by WWII can be seen starting in 1940. B) Measles dynamics for London 1897–1991, shown on a weekly time scale with mortality (red) until 1940, and incidence (blue) through 1990. Note the case data are shown on a square root scale. Unscaled data are shown (inverted) in Fig 2.

