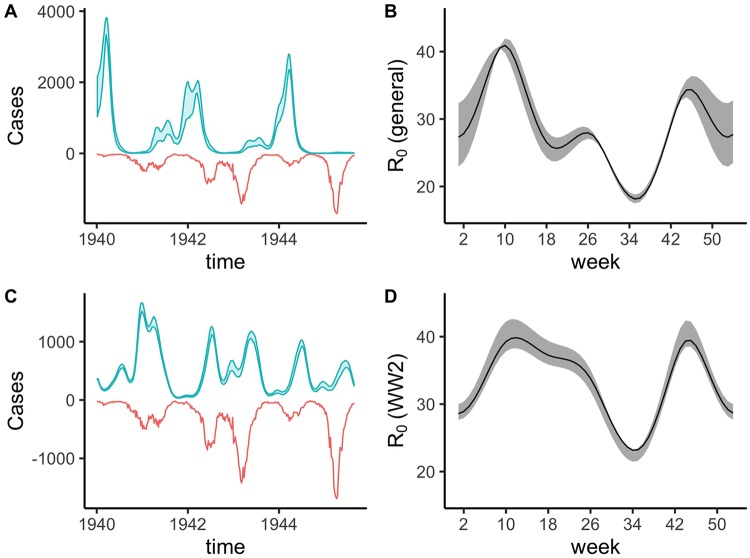
Fig 4. A comparison of predicted against observed measles dynamics for the subsetted WWII time period (1940 to 1946).
A) The predicted dynamics using the fitted model against the whole time series with the same visual fit information as Fig 2. B) The inferred seasonality across the whole-time series with mean R0 = 29. C) The predicted dynamics fit to just the WWII time period with the inferred seasonality in D). D) The inferred seasonality in just the WWII time period with average R0 = 33. Note the local WWII fit produces a lower amplitude seasonality pattern. In both B) and D) 95% confidence intervals (calculated using the chi-square approximation of the likelihood ratio test) on the inferred seasonality pattern are shown in shaded gray, while the inferred values are shown in solid black. Note that the seasonality pattern in D) yields a stronger fit the data while maintaining a generally lower amplitude.

