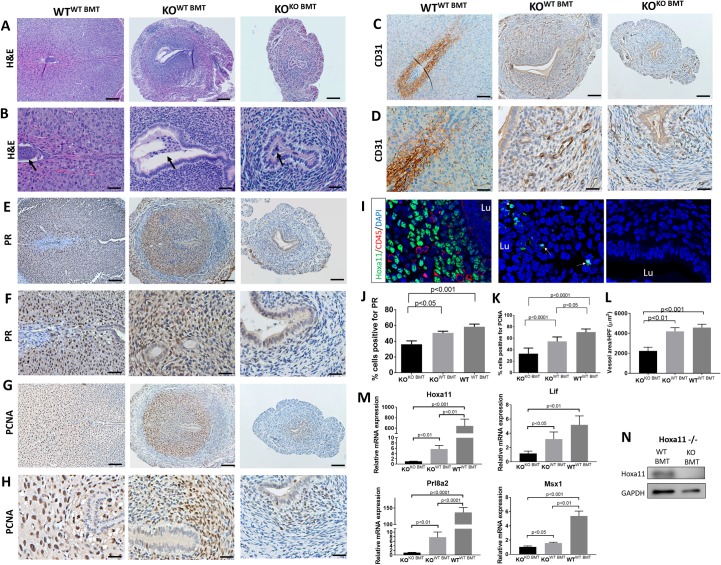
Fig 7. BM transplantation from WT donors leads to decidualization reaction in Hoxa11-null mice.
(A-H) Sections of E5.5 implantation sites from WTWT BMT, KOWT BMT, and KOKO BMT stained with HE (A and B), CD31 (C and D), PR (E and F), and PCNA (G and H). B, D, F, and H are higher magnification photomicrographs of A, C, E, and G, respectively. Black arrows point to embryos. (J, K and L) Quantification of pecent PR-positive cells (J), percent PCNA-positive cells (K), and mean blood vessel luminal area (μm2) in the endometrium (n = 3–4 mice/group). (I) Sections of E5.5 implantation sites from WTWT BMT, KOWT BMT, and KOKO BMT co-stained with Hoxa11 (green), CD45 (red), and counterstained with DAPI (blue). Arrows point to Hoxa11-expressing cells. (M) Relative uterine mRNA expression of HoxA11 and implantation-related genes Prl8a2, Lif, and Msx1 normalized to GAPDH in WTWT BMT versus KOWT BMT versus KOKO BMT on E5.5 (n = 4–5 mice/group). (N) Uterine Hoxa11 protein expression in KOWT BMT versus KOKO BMT on E5.5. Bar graphs represent mean ± SEM. p-values are noted on the graphs. Scale bars, 100 μm (A, C, E, G), 50 μm (B, D, F, H). Underlying data are available in S1 Data. BM, bone marrow; BMT, BM transplant; GAPDH, glyceraldehyde 3-phosphate dehydrogenase; HE, hematoxylin–eosin; Hoxa11, Homeobox a11; KO, knockout; PCNA, proliferating cell nuclear antigen; PR, progesterone receptor; WT, wild-type.

