Fig. 10.
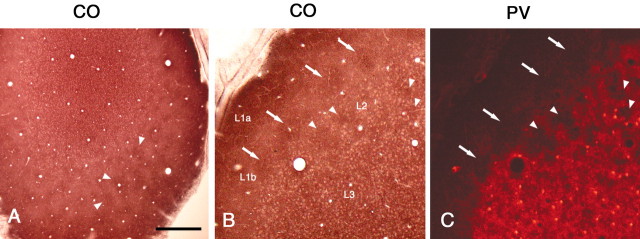
CO histochemistry shows diffuse strong staining in layer 1 and a patchy pattern in layers 1b and 2 (A, tangential section; B, deeper, semi-tangential section). Double staining for CO (B) and PV (C) shows that CO-dense regions in layer 2 are situated within the PV hollows, like VGluT2. Arrowheadspoint to CO-dense patches in A and to corresponding hollows for PV and dense regions for CO in B.C, Arrows point to CO-positive region in layer 1b, above the PV-ir hollows. Scale bar (shown inA): A, 500 μm; B,C, 100 μm.

