
Fig. 5.
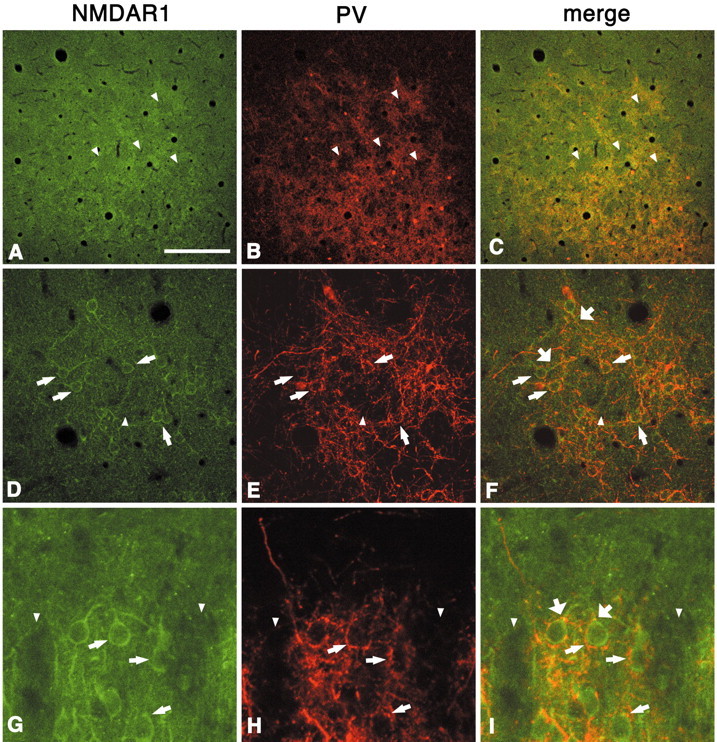
Immunoreactivity for NMDAR1 shows a periodic pattern that, after double labeling, is seen to correspond with the PV walls (A–C, tangential section; D–F,higher magnification; G–I, higher magnification in coronal section). Most NMDAR1-ir cell bodies exist in the walls (D–I, thinner arrows) and are surrounded by PV-ir basket-like puncta. NMDAR1-ir proximal dendrites also seem to be targeted by PV-ir terminals (F, I, thicker arrows).Arrowheads point to corresponding hollows in both markers. Scale bar (shown in A): A–C, 200 μm; D–F, 100 μm; G–I, 30 μm.