
Fig. 6.
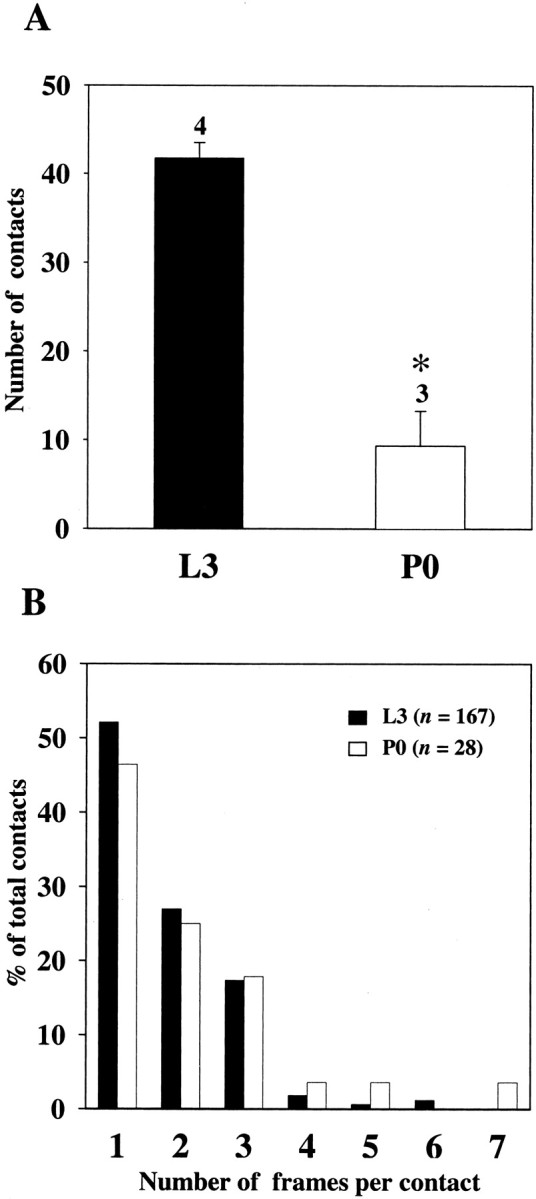
Quantification of the number and size of putative synaptic contacts between posterior PH-SNs and APRs on days L3 and P0.A, Columns indicate the mean number of putative synaptic contacts between posterior PH-SNs and APRs on day L3 (black column; n = 4) and on day P0 (white column; n = 3). Error bars indicate SEM. The number of putative synaptic contacts was significantly reduced on day P0. *p < 0.001; Student's t test. B, The putative synaptic contacts identified in all preparations on day L3 (n = 167 contacts) and on day P0 (n = 28 contacts) were divided into categories based on the number of adjacent frames (at 0.5 μm intervals) in which the contact appeared (range, 1–7 frames). The proportion of contacts in each category is expressed as a percentage of the total number of contacts counted at that stage. There were no significant differences in the proportion of contacts in each size category (i.e., contacts observed in one frame, two frames, etc.) on days L3 and P0 (χ2 analysis).