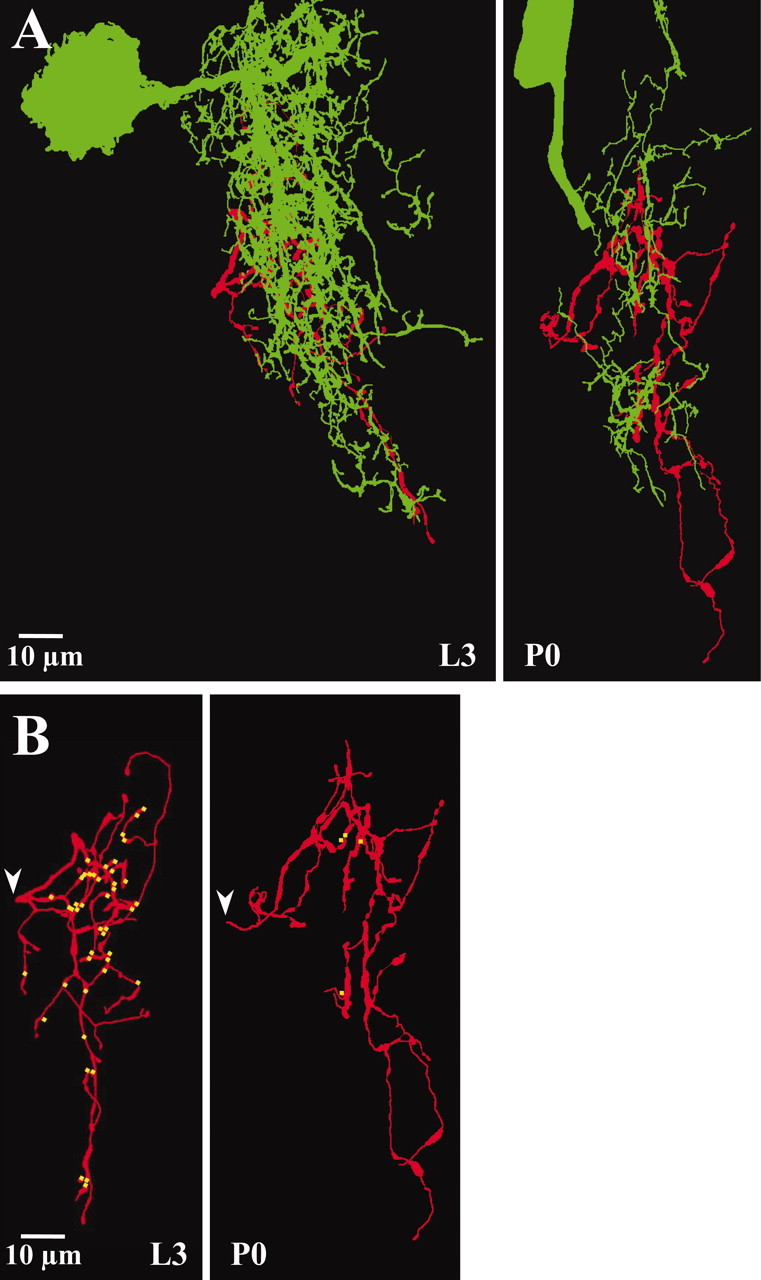
Fig. 7.

Spatial distribution of putative synaptic contacts from posterior PH-SNs to APRs on days L3 and P0. A, Eachpanel shows a two-dimensional projection of the reconstructed axonal arbor of a posterior PH-SN (red) on days L3 (left) and P0 (right), with the portion of the APR dendritic arbor (green) that occupied the same volume of neuropil as the PH-SN superimposed. Images are oriented as in Figure 2 (anterior is up). The arbor of APR within sensory neuropil was less extensive on day P0 than on day L3, providing fewer opportunities for synaptic contact (also see Fig.4). B, Each panel shows a two-dimensional projection of the same reconstructed PH-SNs (red) that appear in A. The locations of putative output synapses onto APR are marked in yellow (the yellow dots indicate the location, not the size, of the putative synaptic contacts). Arrowheads indicate the site at which the PH-SN axons entered the neuropil. In this example, there were 43 putative synaptic contacts between the posterior PH-SN and APR on day L3 and four putative synaptic contacts on day P0.
