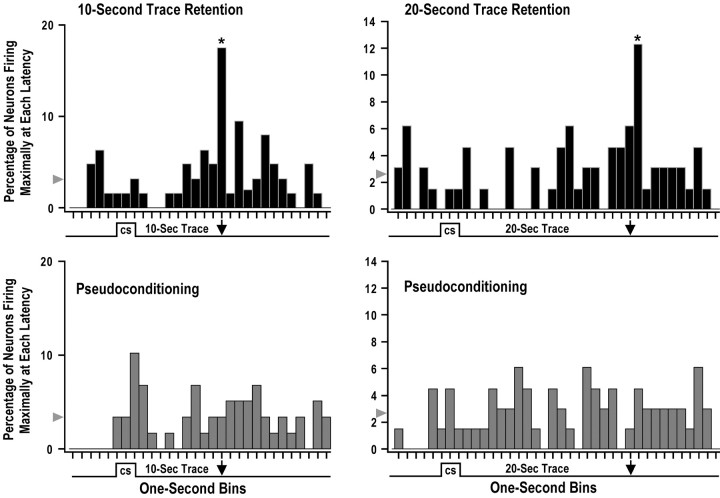
Fig. 3.
Distribution of maximal firing latencies for CA1 neurons recorded on the initial CS-alone retention trials. The maximal firing latency was calculated for each single neuron using the first five CS-alone retention trials, and each 1 sec bin in this figure shows the percentage of single neurons that fired maximally at a specific latency during these CS-alone trials. Although the US was not presented on the CS-alone trials used in this analysis, the arrowshows when the US was presented on previous trace fear conditioning trials. The arrowhead indicates the chance percentage of maximal firing for each bin. The top left panel shows that 17.5% of the 63 CA1 neurons from the 10 sec trace conditioning group fired maximally 10 sec after CS offset (asterisk) on the initial CS-alone retention trials. This bin was significantly greater than chance, and the bottom left panel shows that there did not appear to be any distinct maximal firing latency for the 59 matched pseudoconditioning neurons. The top right panel shows that 12.3% of the 65 CA1 neurons from the 20 sec trace conditioning group fired maximally 21 sec after CS offset (asterisk) on the initial CS-alone retention trials. This bin was significantly greater than chance, and there did not appear to be any distinct maximal firing latency for the 66 matched pseudoconditioning neurons in the bottom right panel. These data show that a significant percentage of CA1 single neurons encode the duration of the trace interval during trace fear conditioning.

