Fig. 4.
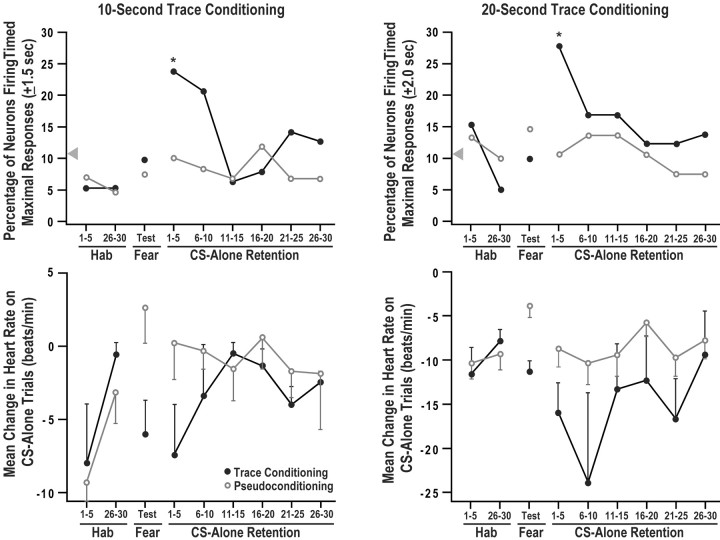
Conditioned HR responses and percentage of CA1 neurons firing timed maximal responses across five trial blocks for the 10 sec trace group (left) and the 20 sec trace group (right). The top panels show the percentage of neurons exhibiting maximal firing timed to the duration of the trace interval on the first and last five CS-alone trials of habituation (Hab), the CS-alone test trials of pseudo and fear conditioning (Fear), and each of the five trial blocks of the CS-alone retention session. Timed maximal firing occurred at 10 ± 1.5 and 20 ± 2.0 sec after the offset of the CS for the 10 and 20 sec trace groups, respectively. This produced a 3 and 4 sec duration response window for these groups, which is longer in duration than the 1 sec bins used in Figure 3; therefore, the percentage of neurons firing maximally will be larger in this figure. The asterisks indicate that during the first five CS-alone retention trials, the trace groups exhibited a significantly greater percentage of neurons with timed maximal responses within these response windows compared with the matched pseudoconditioning controls. The arrowhead shows the chance percentage of neurons showing maximal firing in the response window. The bottom panels show the mean change in HR for the same groups on the same blocks of CS-alone trials. Note that the y-axes are scaled differently in the bottom panels to highlight group differences in HR conditioning. Significant HR conditioning occurred during the fear conditioning session and during the initial blocks of retention. These data indicate that the time course for CA1 encoding of trace interval duration was parallel to the time course for the expression of the HR fear response. Bars indicate SEM.

