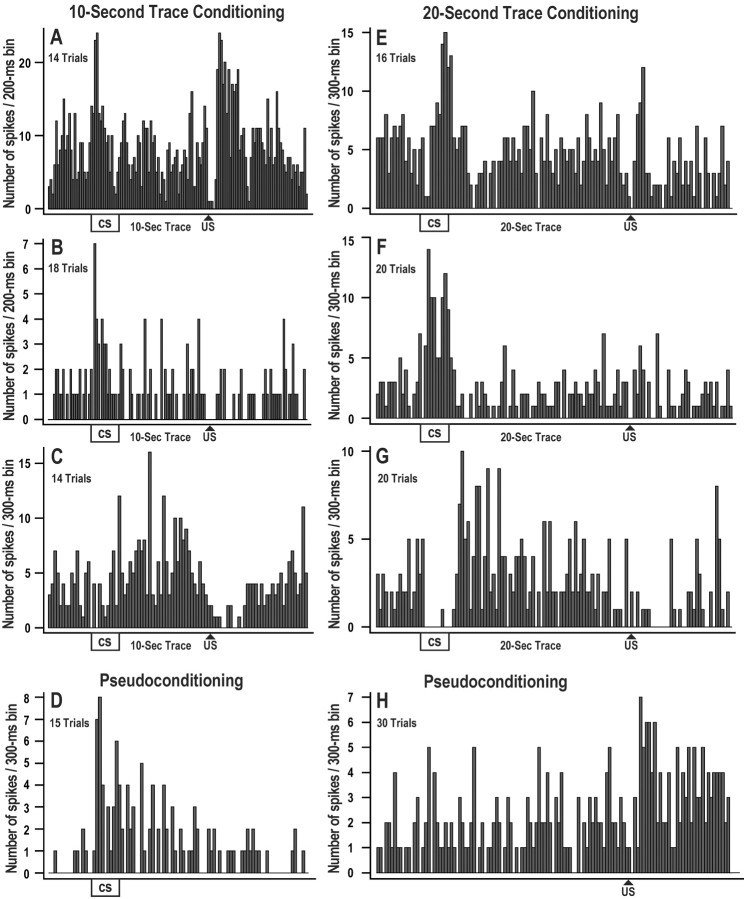
Fig. 7.
Histograms of exemplar CA1 single neurons recorded during trace fear conditioning or pseudoconditioning. Each histogram shows the sum of action potentials in 200 or 300 msec bins across 14–30 fear conditioning trials with a 10 sec trace interval (A–C) or a 20 sec trace interval (E–G). Neurons A andB show excitatory responses to the CS and US during trace fear conditioning. Neurons B and Fshow excitation only to the CS. Inhibitory responses are shown inC and G, with some excitation during the trace interval. Neurons D and H show excitatory responses during pseudoconditioning. Overall, excitatory and inhibitory responses to the CS and US were heterogeneous during pseudo and trace fear conditioning, and these histograms represent only a few of the response profiles observed. Analyses revealed no group differences or consistent timing effects during the fear conditioning session.

