
Fig. 2.
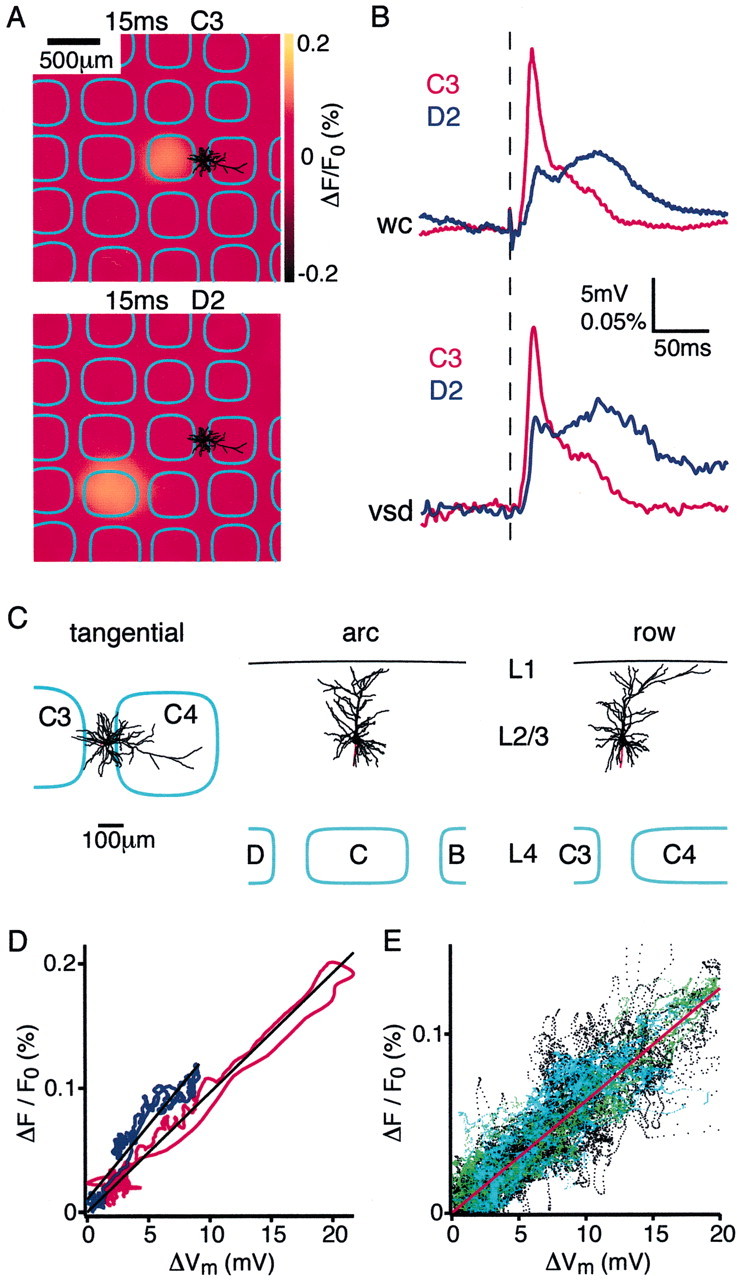
Subthreshold membrane potential changes in layer 2/3 pyramidal neurons are closely correlated with the local voltage-sensitive dye signal. A, The voltage-sensitive dye image of the cortical evoked response recorded 15 msec after deflection of the C3 whisker (top panel) and the D2 whisker (bottom panel). Superimposed are the reconstructed dendrites of the layer 2/3 pyramidal neuron from which a whole-cell recording was made simultaneously with the voltage-sensitive dye imaging. The neuron is located between the C3 and C4 barrels (barrel field with arcs oriented vertically and rows oriented horizontally. The barrels on the left edge belong to arc 1). B, The membrane potential changes evoked by stimulation of the C3 (red) and D2 (blue) whisker recorded in the layer 2/3 pyramidal neuron (top traces). The voltage-sensitive dye signal from a 200 × 200 μm region around the soma of the neuron is quantified (bottom traces). The membrane potential changes of a single neuron appear to be closely correlated with the voltage-sensitive dye signal in time course and relative amplitude, which presumably results from many neurons. C, Three different projections of the three-dimensional reconstruction of the dendritic arbor of the layer 2/3 pyramidal neuron shown inA. D, For the same neuron the VSD signal is plotted as a function of change in membrane potential during the first 200 msec of the whisker response. The two measurements are correlated linearly for the response to both the C3 whisker deflection (red) and the D2 deflection (blue) with a similar calibration constant. The depolarization in membrane potential of a single neuron appears to be closely correlated with the VSD signal in time course and relative amplitude, which obviously originate from many neurons. E, The normalized local VSD signal amplitude plotted as a function of the change in membrane potential across all neurons in the experimental data set. Theblack data points indicate data collected under 1.5–2 gm/kg urethane anesthesia (n = 24), thegreen data points are from experiments using animals that were more lightly anesthetized with 1–1.5 gm/kg urethane (n = 5), and the cyan data points are from experiments conducted under halothane (0.5–1%) anesthesia (n = 3). Under all of these conditions of different levels of anesthesia there is a close correlation between membrane potential changes and VSD signal.