Fig. 7.
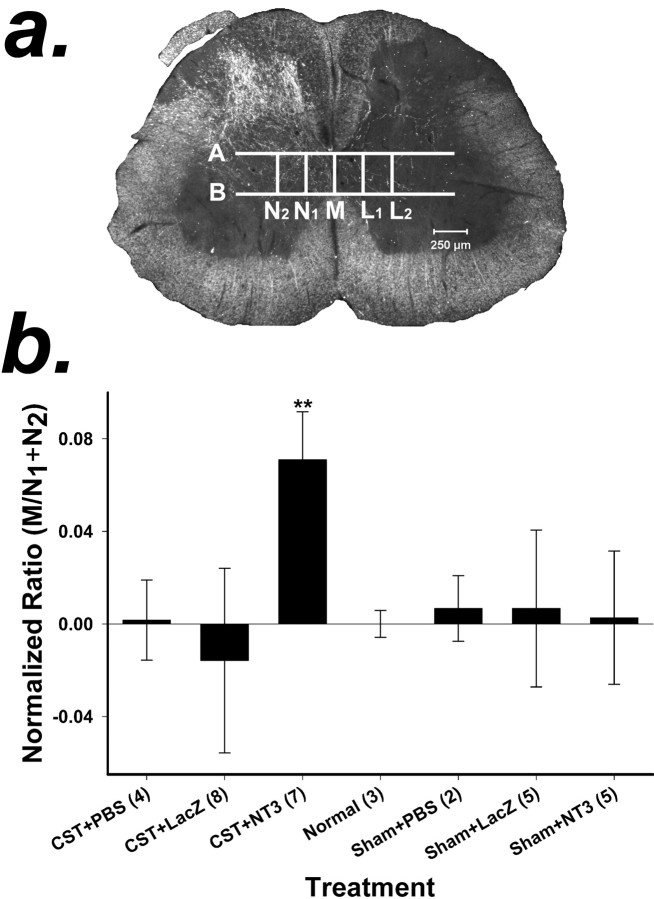
a, Method for quantification of axonal sprouting from the CST across the midline in the spinal cord. Dark-field photomicrographs were taken of each spinal cord section. Five vertical and two horizontal lines were drawn on each photomicrograph of a spinal cord section as reference points for counting axons. M was drawn through the midline,N1 was drawn just lateral to the funiculus of the CST and parallel to M, andN2 was drawn parallel to Mand two times the distance between N1 andM. L1 andL2 were drawn on the lesioned side of the spinal cord and corresponded to lines N1 andN2. Lines A andB were drawn perpendicular to the dorsoventral axis of the cord. A was drawn just below the dorsal columns, andB was drawn just above the ventral columns. Axons that crossed M, N1,N2,L1, and L2within the boundaries of A and B were counted. b, Quantification of CST axons crossing the midline in response to the local expression of NT-3. BDA-positive axons were counted at the midline (M) and at two sites (N1 andN2) in the lateral gray matter of the spinal cord on the side of the unlesioned CST (see Materials and Methods). The ratio of the axons that crossed the midline (M) to those that crossed the two sites in the lateral gray matter (N1 +N2) was computed (M/N1 +N2) to compensate for any variation in the degree of anterograde labeling of the CST. The ratios of the treatment groups were normalized to the ratio of the normal animal group, which was set to zero. A positive value indicates that more axons crossed the midline compared with normal, unlesioned animals; a negative value indicates that fewer axons crossed the midline compared with normal animals. Values are means ± SD; **p < 0.01 (ANOVA followed by the Student–Newman–Keuls test). Numbers inparentheses represent the number of animals per group.

