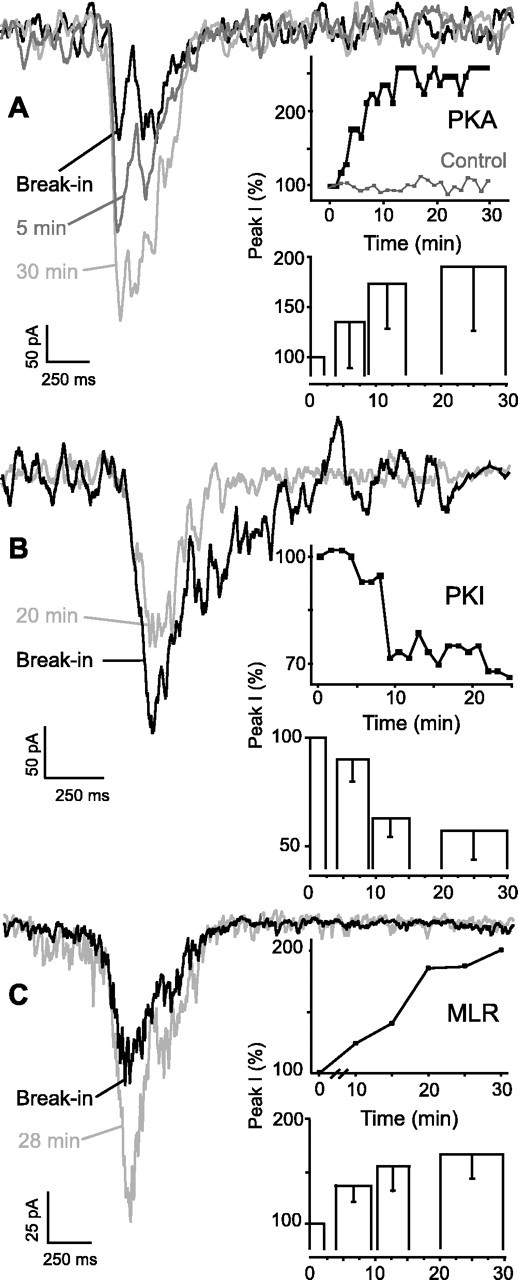
Fig. 1.

Effects of PKA and phosphatase manipulation on inspiratory drive currents. A, Effect of intracellular dialysis of activated PKA enhanced peak endogenous glutamatergic inspiratory drive currents in XII motoneurons. Potentiation of synaptic drive currents of a PKA dialyzed XII motoneuron 1, 5, and 30 min after establishing whole-cell recording (break-in;Vh = −70 mV) is shown.Traces are averaged (n = 10).Inset, top, Time course (for traces shown at left) of peak whole-cell inspiratory drive current in an XII motoneuron in response to dialysis with PKA (250 U/ml). Control time course without PKA demonstrates the stability of recordings.Bottom, Group data (n = 7) histogram for XII motoneurons dialyzed with activated PKA. Here and elsewhere, histogram widths reflect the temporal epochs that were averaged.B, Intracellular dialysis of PKI diminished peak inspiratory drive currents in XII motoneurons. Decreased endogenous currents of XII motoneuron dialyzed with PKI immediately after establishing recording and 20 min later are shown (n = 10). Inset, top, Time course of normalized peak currents from an XII motoneuron dialyzed with PKI (500 μg/ml). Bottom, Group data (n = 5) histogram for XII motoneurons dialyzed with activated PKI. C, Intracellular dialysis of MLR enhanced endogenous inspiratory drive in XII motoneurons. An average of six consecutive traces for an XII motoneuron dialyzed with microcystin (50 μm) immediately after whole-cell break-in and at 28 min after establishing recording is shown. Inset, top, Time course of peak whole-cell current in an XII motoneuron in response to dialysis with microcystin.Bottom, Group data (n = 5) histogram for XII motoneurons dialyzed with MLR. Peak inspiratory current values are normalized to amplitude immediately after break-in [Peak I(%)]. Top inset graphs correspond to thetraces shown at left for eachpanel. Histograms represent pooled, averaged, and normalized data comparing peak currents obtained immediately after break-in with maximal enhancement of current magnitude at times indicated; error bars indicate sd.
