
Fig. 2.
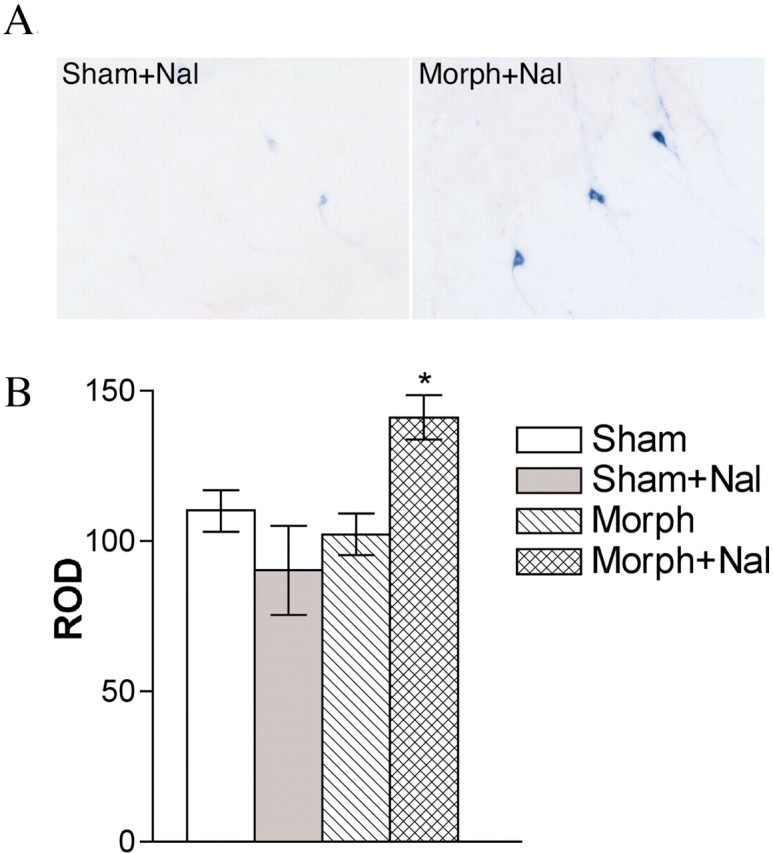
Withdrawal induces orexin gene expression in orexin-τ-LacZ mice. A, A representative image showing β-gal staining in the LH after sham plus naltrexone (Nal; left) or morphine (Morph) plus naltrexone (right). B, Mean optical densities are indicated (n = 5 per group). ROD, Relative optical density.