Fig. 5.

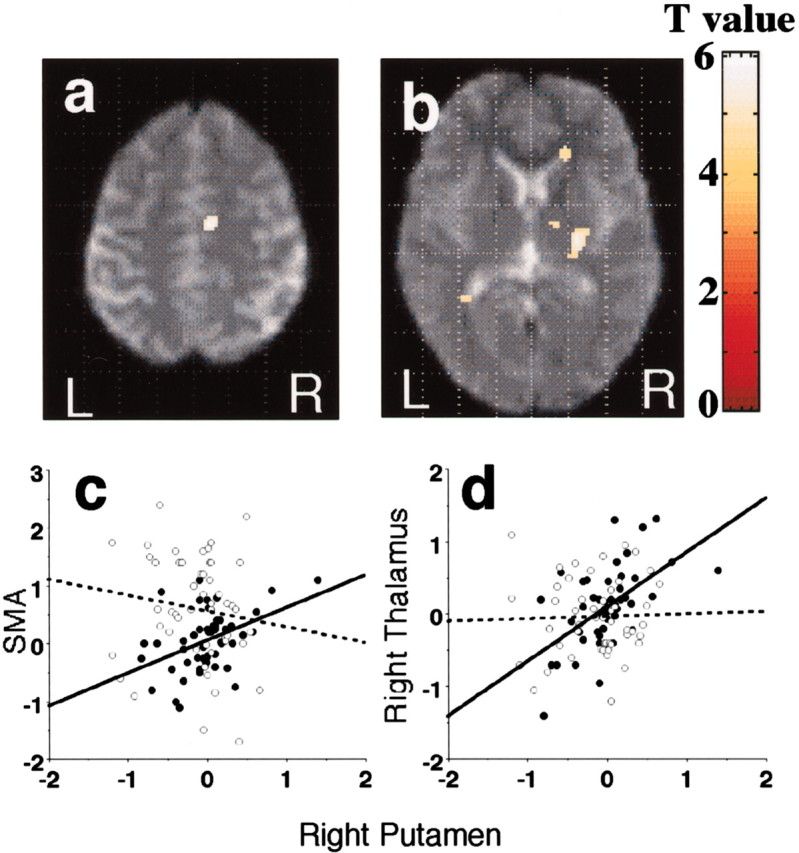
SMA (a) and right thalamus (b) showing a significant increase in functional connectivity with right putamen in SI movement versus ET movement. R, Right; L, left. c, d, Scatterplots of the fMRI percentage signal changes in the right putamen (x,y, z = 26, −6, 12) versus SMA (8, −14, 50) (c) and the right putamen versus the right thalamus (14, −10, 4) (d) during SI (●) and ET (○). Two regression lines (a solid line for SI and a broken line for ET) are overlaid in each group, and each line shows the percentage signal change per movement rate across each subject. Note that the slopes of regression lines are significantly different.
