
Fig. 1.
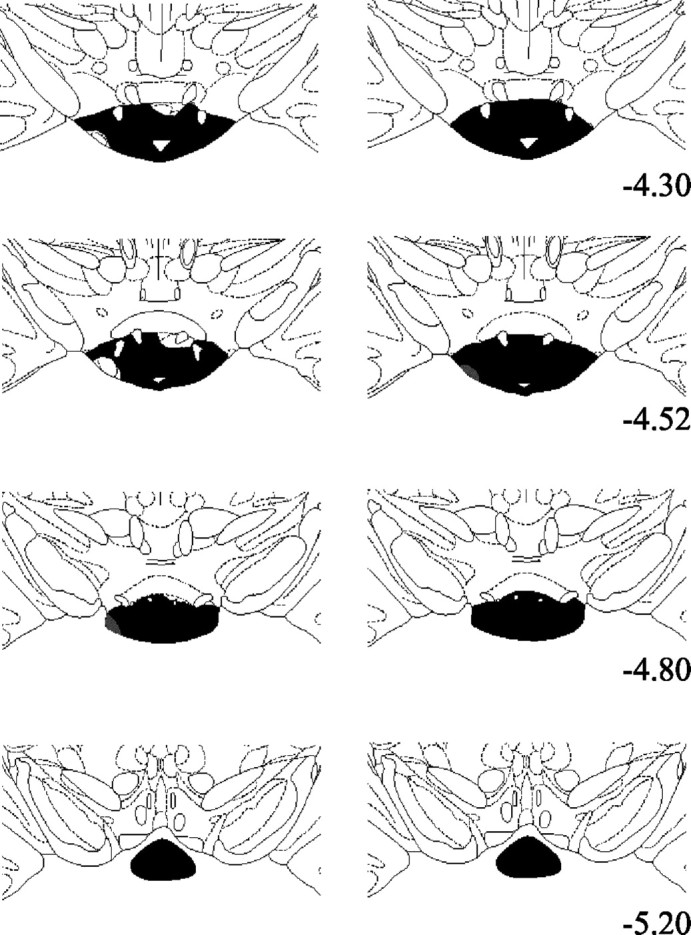
Diagrammatic reconstructions showing the extent of MB lesions. Areas in black show complete loss of neurons, whereas gray areas show partial cell loss. The left column depicts the smallest of the MB lesions, and the right column depicts the largest. The sections are modified from Paxinos and Watson (1997), and the numbers indicate the distance from bregma.