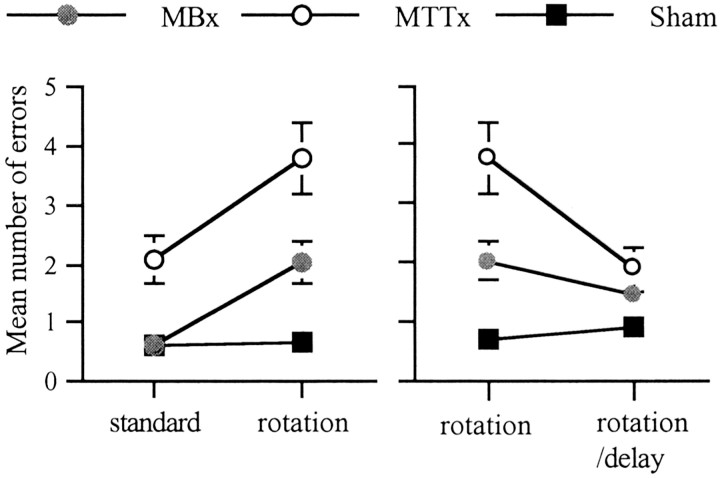
Fig. 6.
Radial-arm maze task (experiment 2). The left-hand graph shows the number of errors for the last four trials of the standard task compared and four trials with maze rotation. The right-hand graph shows the number of errors for 4 d of standard maze rotation and 4 d of maze rotation with 20 min delays. Data are shown as mean ± SE; where SE is very small, it is not visible on the graph.

