
Fig. 3.
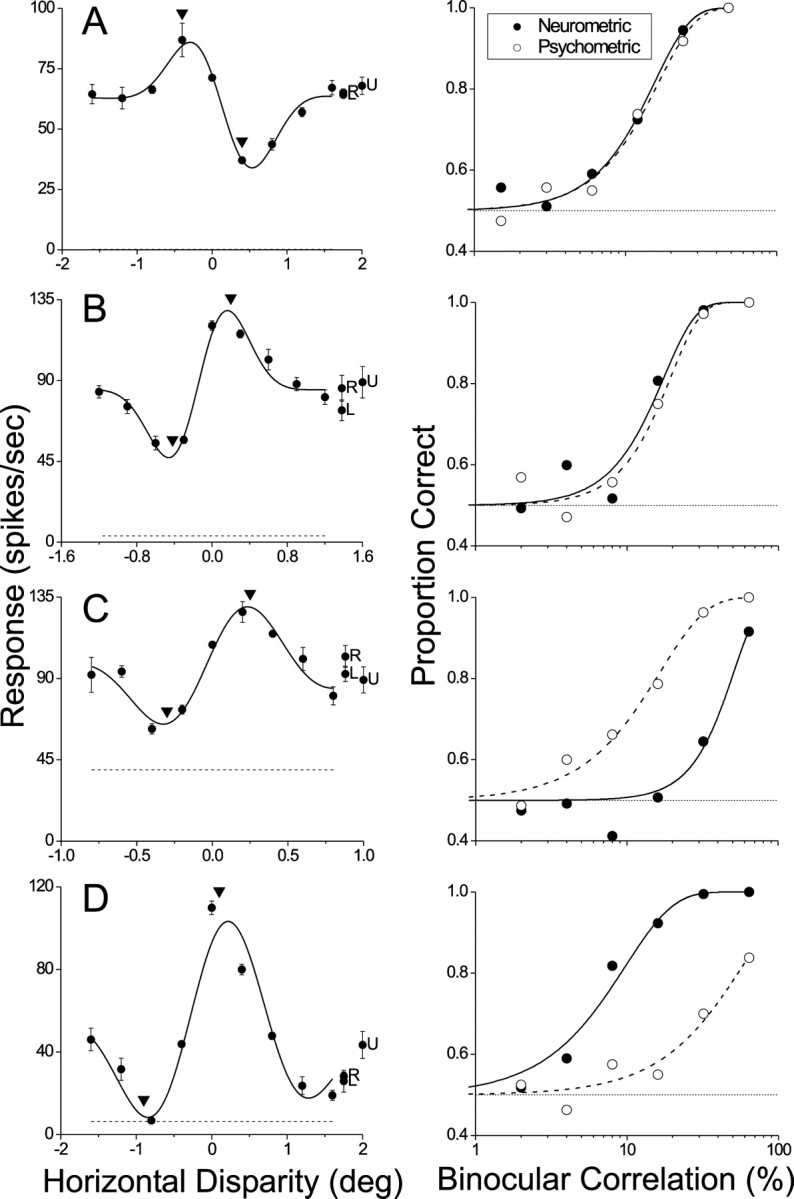
Disparity tuning curves (left) and neurometric/psychometric functions (right) for four additional MT neurons. Error bars denote ±SE. A, For this data set the neurometric and psychometric functions were nearly identical. Thresholds were 15.6 and 16.6%; slopes were 1.82 and 1.74. Neither of these differences was significant (p > 0.05). B, Another example in which neurometric and psychometric functions were statistically indistinguishable (p > 0.05). Thresholds were 17.6 and 19.5%; slopes were 2.06 and 2.18. C, An example in which the neuronal threshold (51.0%) was significantly larger than the psychophysical threshold (16.6%; p < 0.05). Slopes of the two curves (2.60 and 1.41) were not significantly different (p > 0.05). D, An extreme example for which the neuronal threshold (9.73%) was significantly smaller than the psychophysical threshold (57.7%;p < 0.05). Slopes of the two curves (1.36 and 1.34) were not significantly different (p > 0.05).