
Fig. 4.
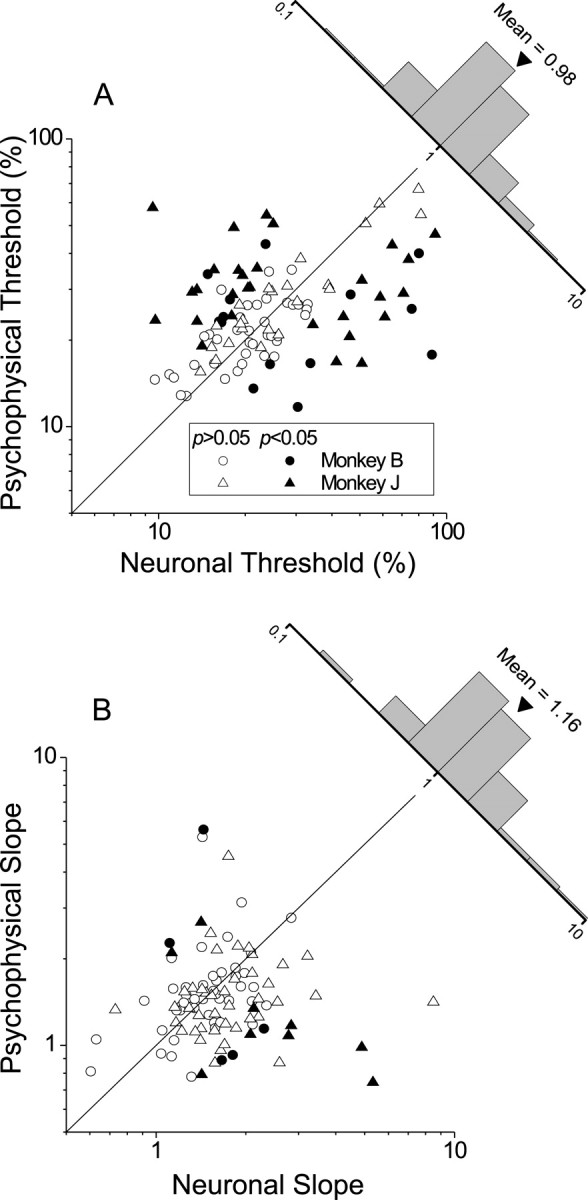
Population data from 104 MT neurons (52 from each monkey). A, Comparison of neuronal and psychophysical thresholds. Filled symbols indicate cases in which the neuronal and psychophysical thresholds are significantly different (p < 0.05). Circles and triangles indicate data from monkeys B and J, respectively. The histogram (top right) shows the distribution of neuronal-to-psychophysical threshold ratios.B, Comparison of slopes of neurometric and psychometric functions in the same format as A.