Fig. 3.
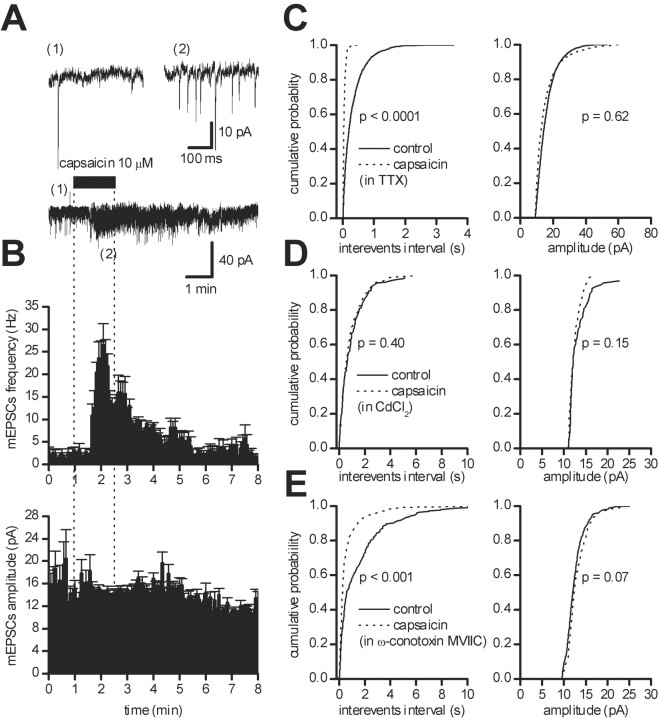
Action potential and calcium dependence of the excitatory effects of capsaicin. Recordings were performed in the presence of picrotoxin (100 μm) and TTX (1 μm). A, Bath perfusion of capsaicin (10 μm) for 2 min induced an increase in mEPSC frequency. The top panel shows expanded trace records before (1) and during (2) capsaicin. B, Running average histogram of the mEPSC frequency (top) and amplitude (bottom) of the recorded cell inA, showing the increase in mEPSC frequency without significant changes in mEPSC amplitude. C, Cumulative probability distributions of interevent intervals (left) and of the peak amplitude (right) of mEPSCs from the neuron shown inA in controls (solid line) and during capsaicin (dotted line). D, Cumulative probability distributions of interevent intervals (left) and of the peak amplitude (right) of mEPSCs from a single neuron recorded in the presence of TTX (1 μm) and CdCl2 (100 μm) in controls (solid line) and in the presence of 10 μmcapsaicin (dotted line). E, Cumulative probability distributions of interevent intervals (left) and of the peak amplitude (right) of mEPSCs from a single neuron recorded in the presence of TTX (1 μm) and ω-conotoxin MVIIC (1 μm) in controls (solid line) and in the presence of 10 μmcapsaicin (dotted line).

