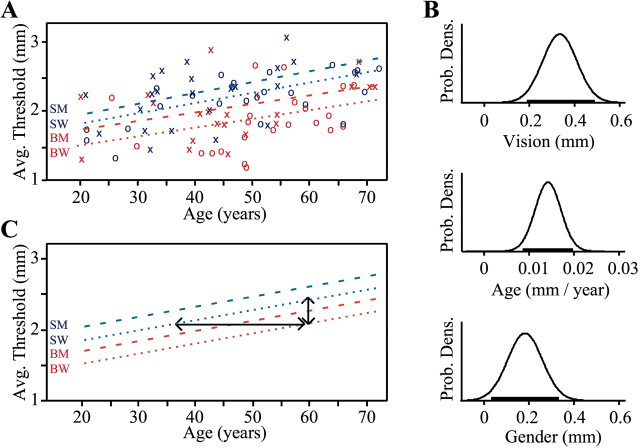
Fig. 4.
Effects of blindness, age, and gender.A, Each subject's average threshold (average of all 10 testing blocks) plotted against age. Blind, Red; sighted, blue; women, ○; men, ×. Best-fit linear regression lines are shown for sighted men (SM), sighted women (SW), blind men (BM), and blind women (BW).B, Results of ANCOVA showing posterior PDFs for the effects of vision, age, and gender. Horizontal bars indicate 95% confidence intervals. C, Best estimates for the effects of vision, age, and gender, representing the modes of the PDFs fromB. The 0.33 mm difference between blind and sighted subjects of the same gender (vertical arrows) is equivalent to an age difference of 23 years (horizontal arrows).

