Fig. 6.
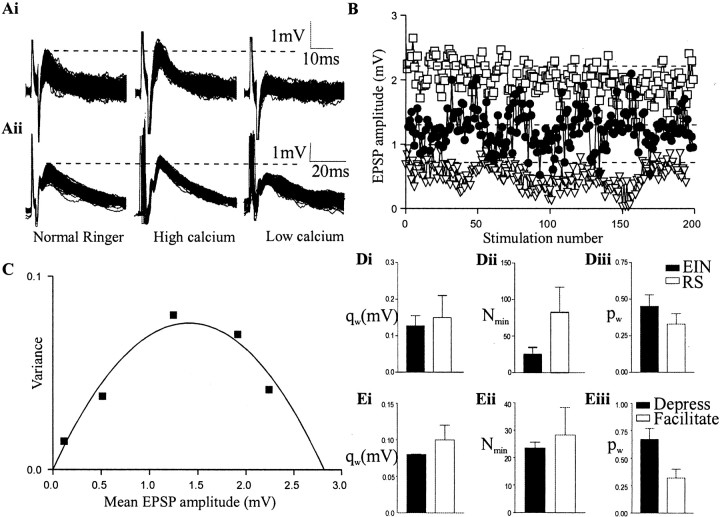
Variance–mean analysis of EIN synaptic transmission. A, Traces showing 100 EIN (top traces) or reticulospinal (bottom traces)-evoked EPSPs (evoked at 0.2 Hz) in control and in high- and low-calcium Ringer's solution.B, Graph showing EPSP amplitudes over the stimulation train in different calcium levels (●, control; ■, high calcium; ▿, low calcium). C, Plot of the EPSP variance against the EPSP mean in control and in high- and low-calcium Ringer's solution. Di–Diii, Histograms of theqw,Nmin, andpw of EIN and reticulospinal (RS) inputs to motor neurons. Histograms showing the quantal amplitude (qw) (Ei), minimum number of release sites (Nmin) (Eii), and release probability (pw,) (Eiii) at facilitating and depressing EIN connections.

