
Fig. 10.
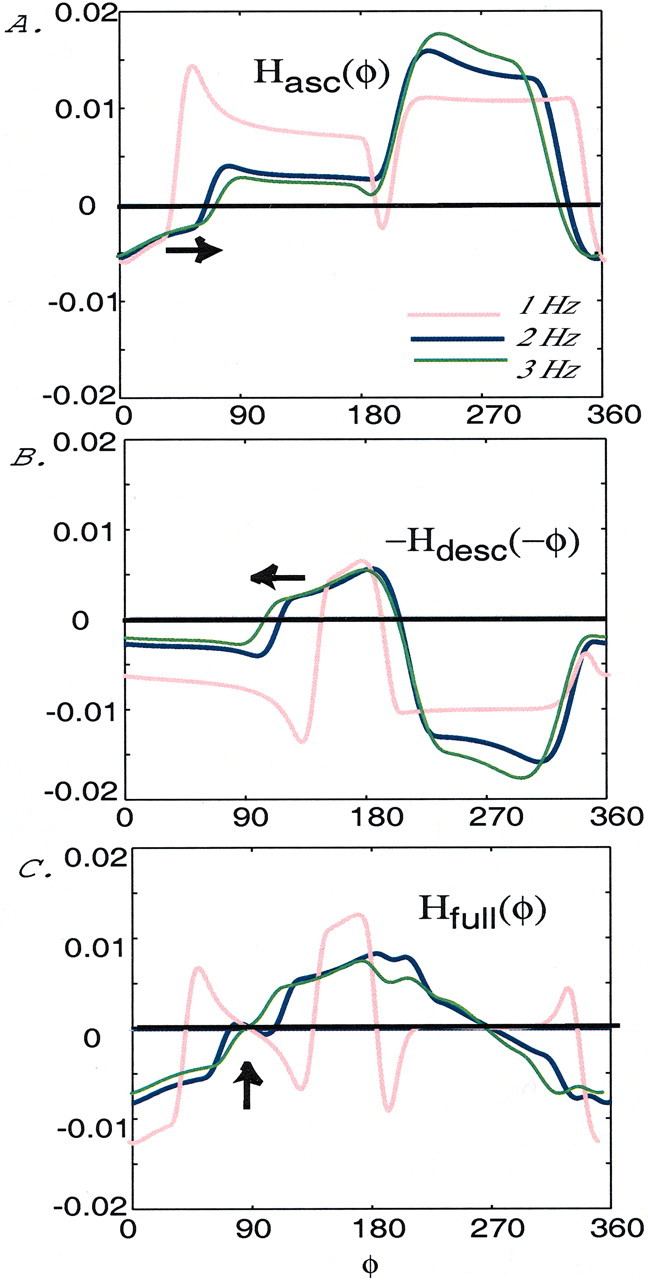
Persistence of the ∼90° phase lag to changes in frequency. A, The coupling functionHasc(φ) for three frequencies, generated in a circuit with an ascending-only intersegmental coupling configuration, as shown in Figure 3. The functionHasc qualitatively shifts to the right as the frequency increases (see arrow), i.e., ε1 increases.B, The coupling function −Hdesc(−φ), for three frequencies, generated in a circuit with a descending-only intersegmental coupling configuration, as shown in Figure 8A. The function −Hdesc qualitatively shifts to the left as the frequency increases (see arrow). C, The coupling function Hfull(φ) for three frequencies, generated in a full network configuration, as shown in Figure 9A. In this case there is a parameter regimen in which the phase lag between cells 4 and 2 remains near 90° despite changes in frequency (see arrow at the points at which the functionHfull crosses zero from below for 2 and 3 Hz). In each figure 1 Hz (ε1 = 0.003) is represented with a red curve, 2 Hz (ε1 = 0.006) is represented with a blue curve, and 3 Hz (ε1 = 0.009) is represented with a green curve.