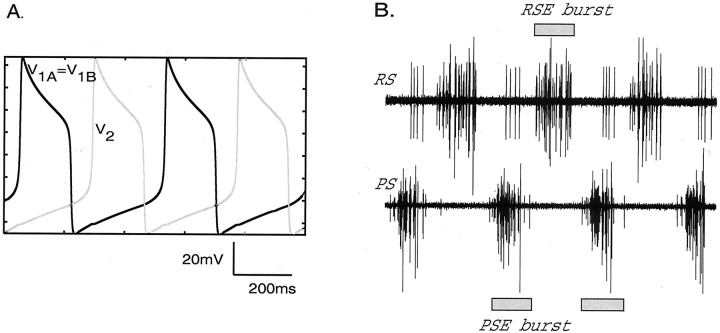
Fig. 2.
Alternating depolarizations of local interneurons in the reciprocally inhibitory model circuit. Shown are voltage versus time traces for cells 2 (gray trace) and 1A (= 1B) (black trace).B, Physiological recordings of PS–RS activity corresponding to A and used to measure the phase of the experimental system. The time scale is the same as inA.

