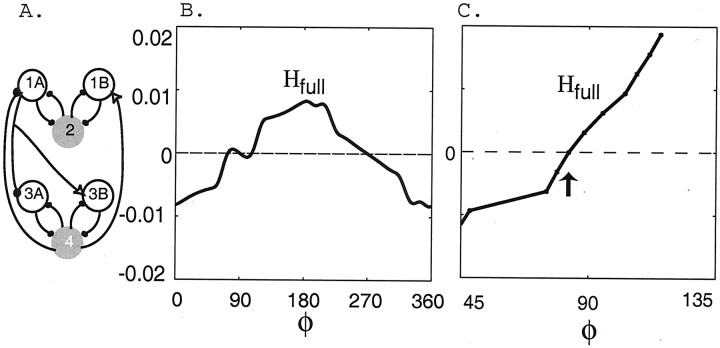
Fig. 9.
The coupling functionHfull(φ) from the fully coupled network (A). B, The leading order functionHfull generated numerically in a network containing both ascending and descending connections as shown inA. C, The functionHfull, including all contributions to frequency changes, not just the leading order ones. There is one stable phase lag at ∼85° for the parameters of this representative simulation (arrow).

