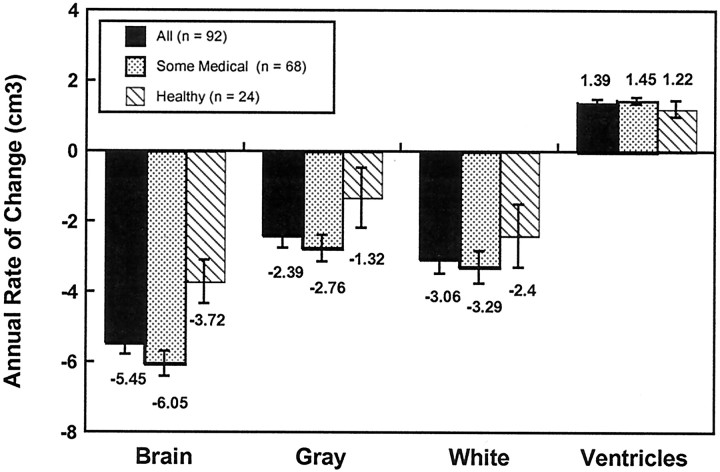
Fig. 3.
Annual rates of change in brain, gray, white, and ventricular volumes (cubic centimeters) for the entire sample, the subgroup with some medical problems, and the subgroup of very healthy individuals. Mean values are displayed at the axis ends. All values are significant at p < 0.001 except gray (NS) and white (p < 0.05) in the healthy group. Note that the nonsignificant trend for gray matter tissue loss in the healthy subgroup is significant in the more sensitive mixed-effects regression analysis (see Results).

