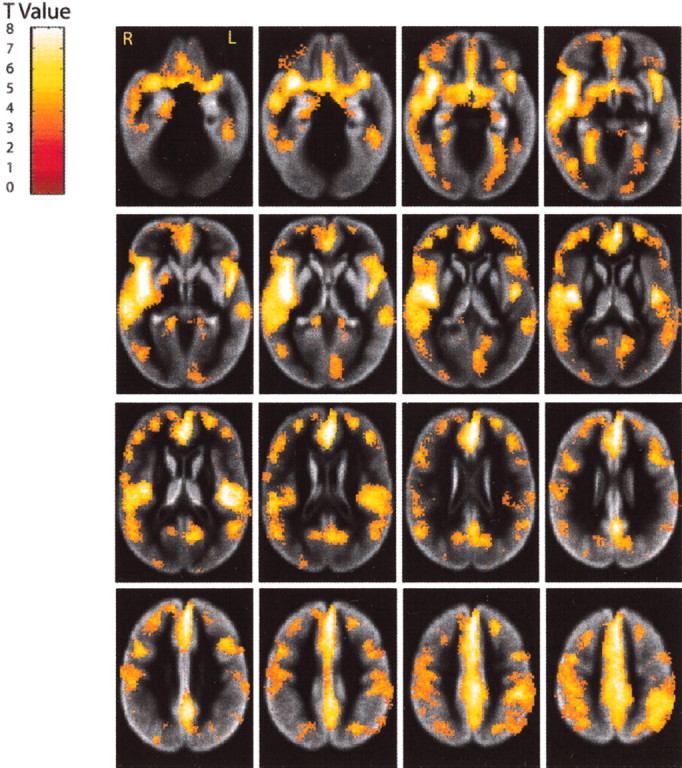
Fig. 4.

Local changes in gray matter volume. Longitudinal declines in tissue volumes over the 4 year interval are shown by the color-coded t score values, calculated from a voxel-based comparison between baseline and year 5 gray matter images. Images are thresholded at p < 0.001 orz = 3.18. To facilitate anatomic localization, significant voxels are superimposed on transaxial slices of a map of the average gray matter distribution of the baseline images after segmentation and stereotaxic normalization. Brighter regions of the gray matter image are more likely to contain gray matter.
