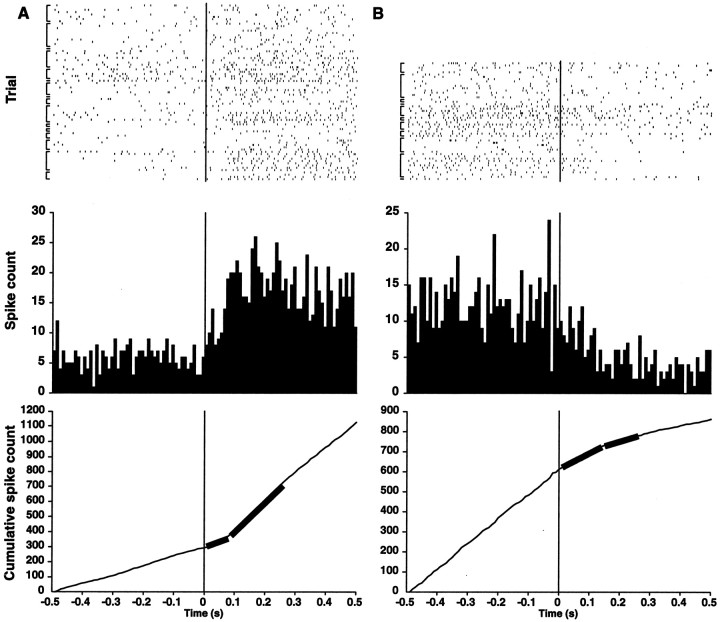
Fig. 2.
Latency of preferred direction updates in HD cells. Raster plots (above), peri-event histograms (middle), and cumulative histograms (below) (bin width = 10 msec) of action potentials recorded from all of the HD cells analyzed. Time 0 indicates when the lights were turned on again. After light onset, the preferred directions return to their initial orientations (A) or shift to the rotated (nonpreferred) orientations (B). To determine the average latency of the preferred direction update, least-squares estimates were computed from the cumulative histograms using the first 250 msec of data after light onset (thick curves) (Friedman and Priebe, 1998). Transition points are at 80 ± 10 msec (A) for returns to the preferred orientation and 140 ± 10 msec (B) for shifts to the nonpreferred orientation. Brackets indicate trials from the same cell within a given session; the variations in spike density among the rows of rasters reflect differences in peak and background firing rates among the neurons.

