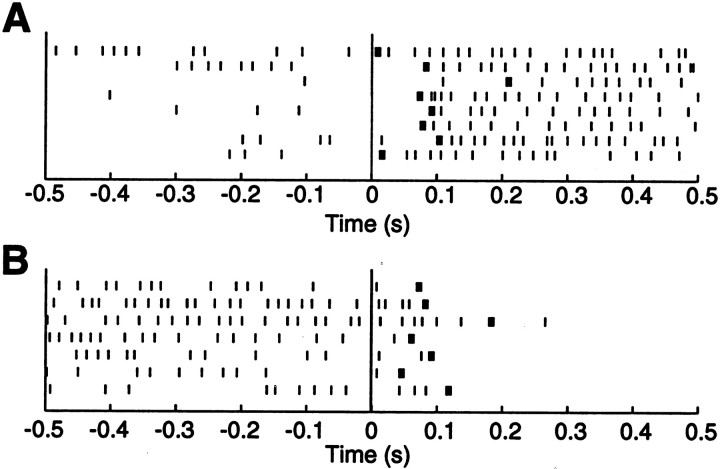
Fig. 3.
A typical analysis of update latency on a trial by trial basis with the method of Seal et al. (1983). Raster plots show action potentials recorded from a single HD cell during a single session, when the firing rate increases (A) or decreases (B) after card rotation. Light onset occurs at time 0. For each trial, the update latency is computed as the maximum likelihood estimator of the change point in the mean interspike interval (thick vertical bars).

