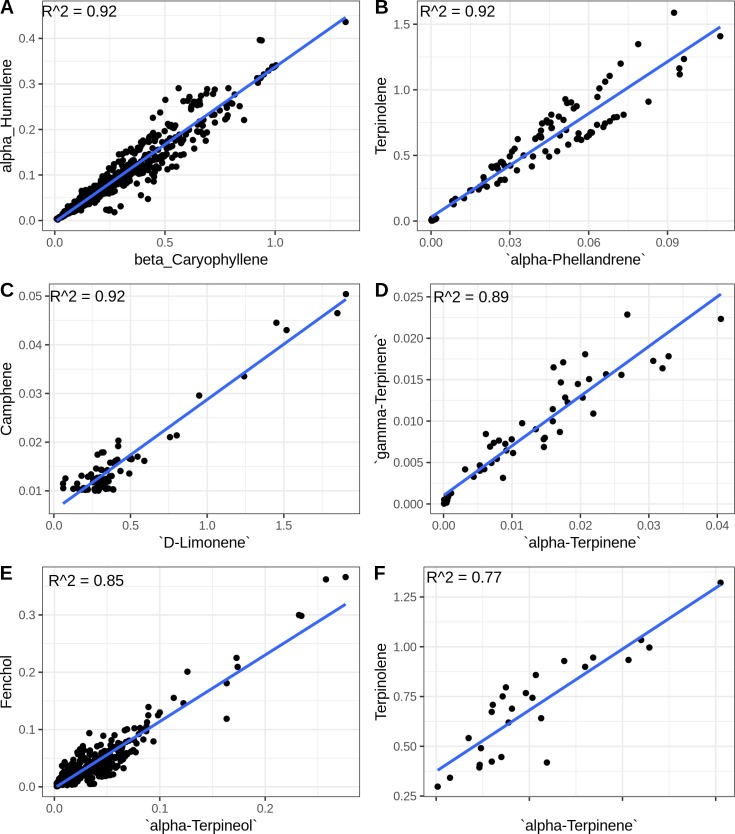
Fig 2. Highly correlated terpenes.Linear relationships between the six most highly correlated compound pairs in this data set.
Regression lines were fitted with the R lm command, the R^2 values are shown in the figure, and the F-test p-values for A-E are less than 2.2e-16, while F has a p-value of 3.296e-09.

