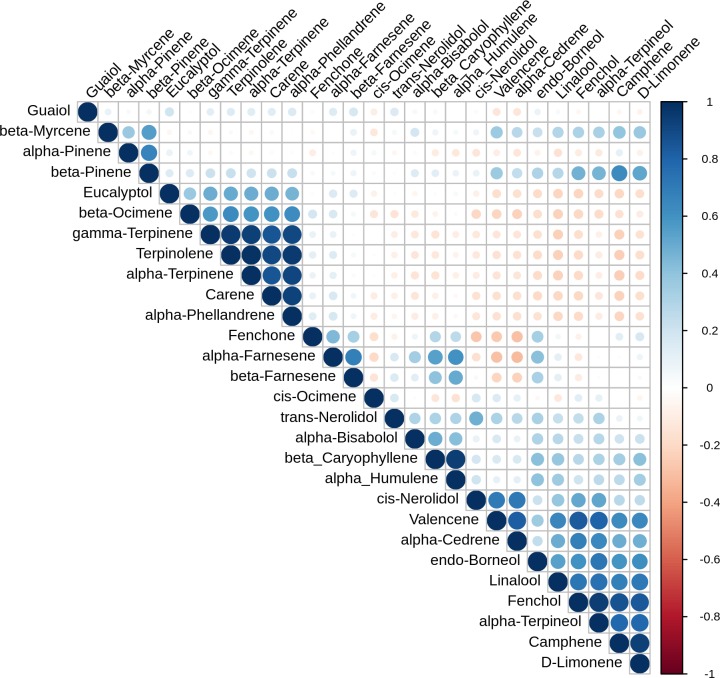
Fig 3. Terpene correlation plot.
Visual representation of the correlation matrix, Darker blue color and larger dot size indicate stronger positive correlation, while darker red means stronger negative correlation. Figure generated using the R corrplot package (https://github.com/taiyun/corrplot).

