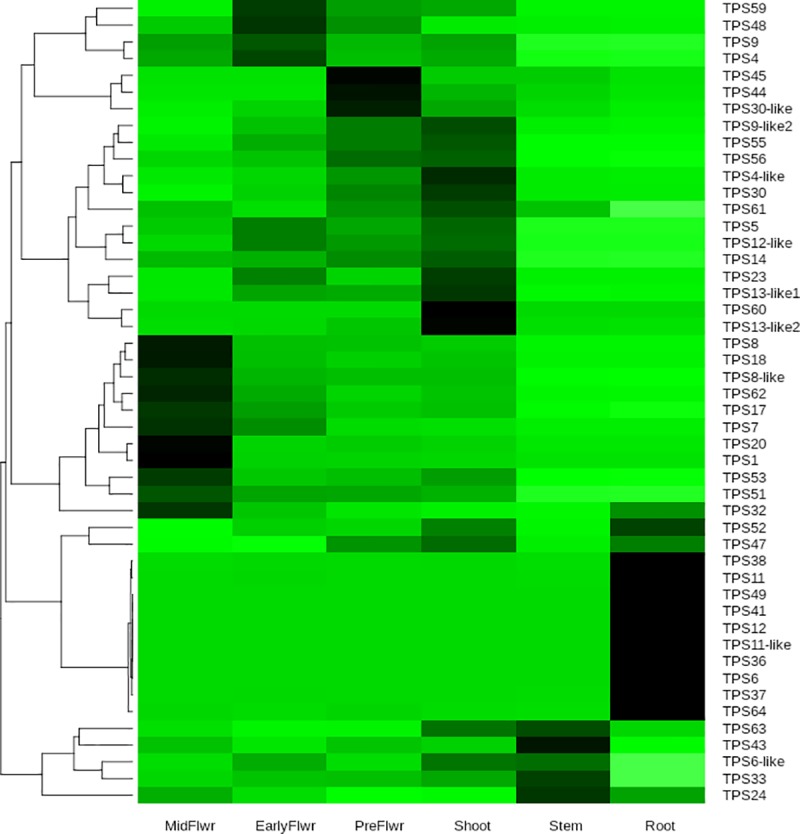
Fig 6. Tissue specific gene expression.

Heatmap of terpene synthase gene expression across the six tissues of the Purple Kush RNA-Seq data set [13] Each gene (row) normalized to percent of total expression for each gene (summed across all tissue types). Darker color means higher percentage of total expression for a given gene.
