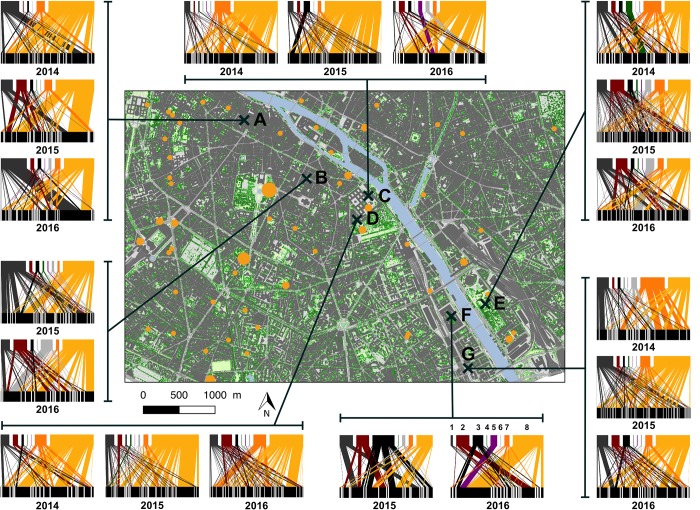
Fig 2. Study sites within Paris (France) and related plant-pollinator networks.
Bipartite networks are retrieved from the compilation of all observed interactions between pollinators (top bar) and plants (bottom bar). Numbers under networks indicate the year. Each pollinator block represents a morphological group and each plant block represents a species. The width of links is proportional to the number of interactions (i.e. pollinating activity). Pollinator morphological groups are classified by order (left to right) colours and numbers: dark grey-1, small solitary bees; dark red-2, large solitary bees; black-3, syrphids; dark green-4, beetles; purple-5, butterflies; flies-6, light grey; orange-7, bumblebees; yellow-8, honey bees. Sites were represented by a capital letter to make the correspondance to S1 Data. Vegetation height and land use maps were obtained from APUR database (http://opendata.apur.org/datasets/).

