
Fig 4. Morphological group visitation rates along the gradient of honey bee colony number in 1000m around our observation sites.
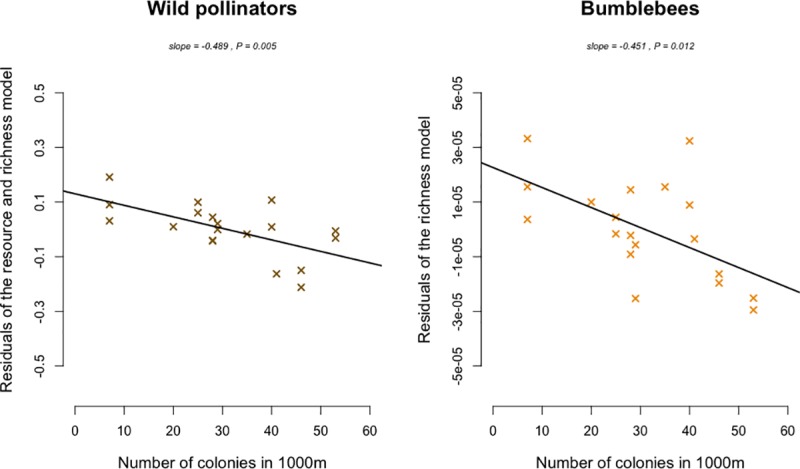
Regressions of best-fit models were represented for each morphological group. When best-fit models included multiple explanatory variables, partial residual regressions were plotted.