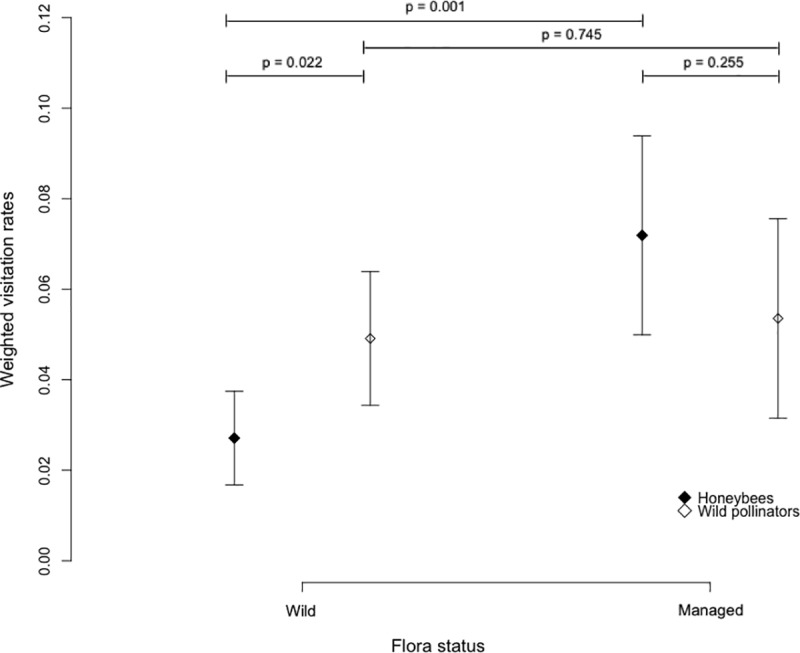
Fig 6. Floral preferences of honey bees and wild pollinators.

Mean visitation rate on wild and managed flora weighted by the percentage of managed and wild plant species sampled at each site. Mean and 95% confidence intervals are represented. P-values were obtained with Student’s t-test.
