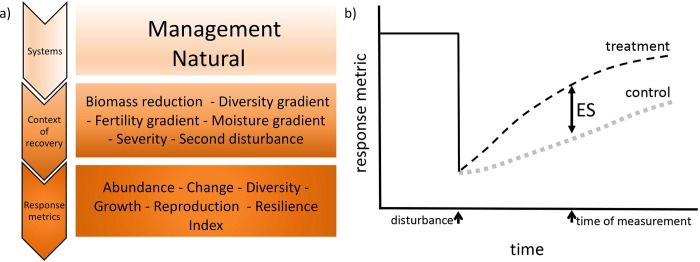
Fig 1. Representation of the analysis.
a) Representation of the hierarchical analysis of effect size. b) Visual representation of the effect size (ES) calculation. Most studies do not describe initial conditions, thus, the pre-disturbance line is hypothetical; these are likely to be different between control and treatment when referring to natural gradients (diversity, fertility and soil moisture).

