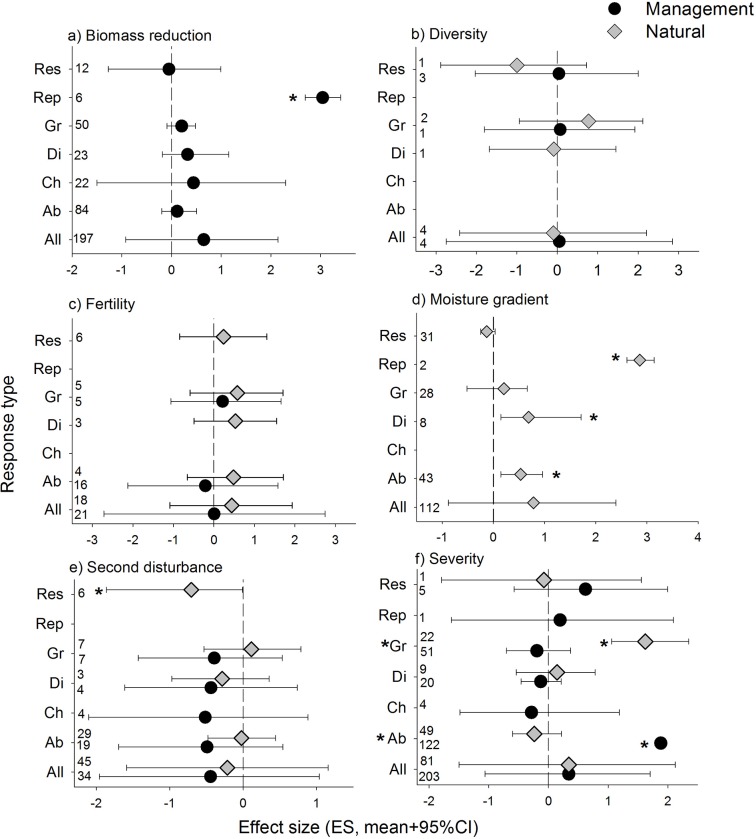
Fig 3. Results from the hierarchical analysis.
Estimated effect size for each combination of system*context of recovery (All) and for each response metric (Ab: abundance, Ch: change, Di: diversity, Gr: growth, Rep: reproduction, Res: resilience). Numbers indicate number of observations available. * Indicates statistical significance, i.e., credible intervals (CI) do not intercept the zero line, or management and natural do not intercept with each other.

