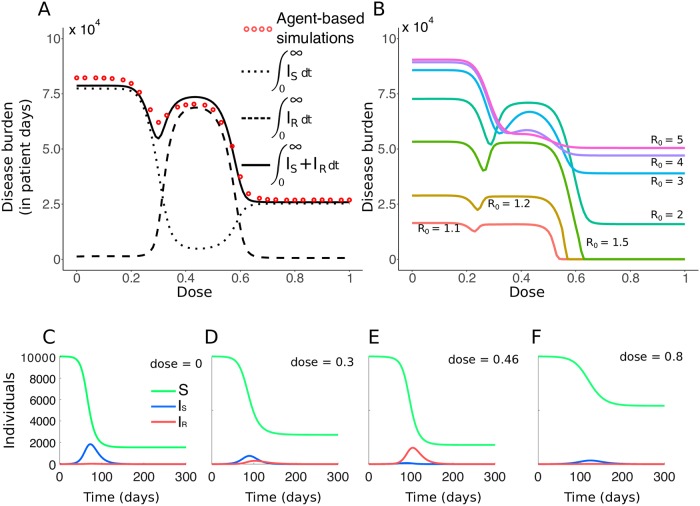
Fig 5. Effect of dose on the disease burden and infection dynamics.
A: Comparison of the disease burden obtained with the nested model and the SIR model (R0 = 2.3). Each red dot represents the mean for 3800 to 4700 runs of simulation of the nested model, with β = 2.5 × 10⁻⁵ days−1. For the SIR model, the contributions of the sensitive and resistant strains to the disease burden are also shown. B: Burden curves (in patient days) for various values of R0. C-F: Exemplary population dynamics of the SIR model for four doses and R0 = 2.3. Note that the burden B is the area-under-the-curve of the sum of the blue and red curves (number of individuals infected by each strain at time t).

