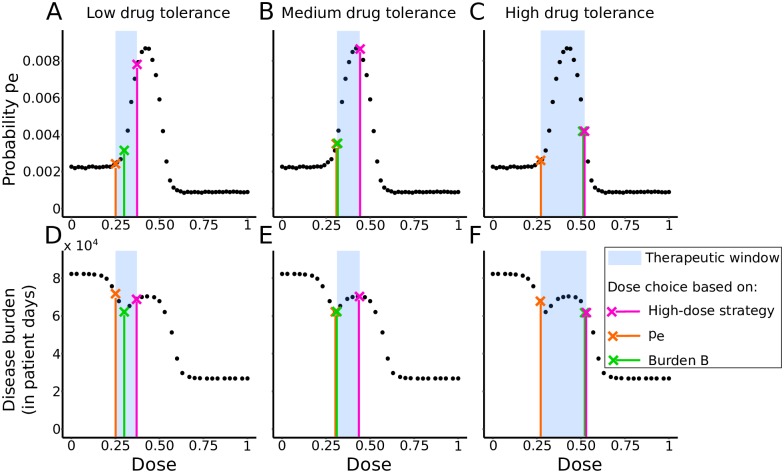
Fig 6. Comparison of three dosing strategies.
Strategy that (1) uses the highest possible dose (pink), (2) uses the dose that minimizes the within-host probability of resistance (orange) and (3) uses the dose that minimizes the disease burden (green). Top row: Effect of each strategy on the within-host probability of resistance pe for three therapeutic windows. The black dots represent probabilities of resistance emergence computed from simulations of the within-host model with varying drug doses. Bottom row: Effect of each strategy on the disease burden B, where we fix β = 2.5 × 10⁻⁵ days−1 (R0 = 2.3). The black dots represent disease burdens computed from simulations of the full nested model. The three therapeutic windows are: (A, D) low-drug tolerance window (0.25 < c < 0.37); (B, E) medium drug-tolerance window (0.32 < c < 0.45); (C, F) high drug-tolerance window (0.27 < c < 0.52).

