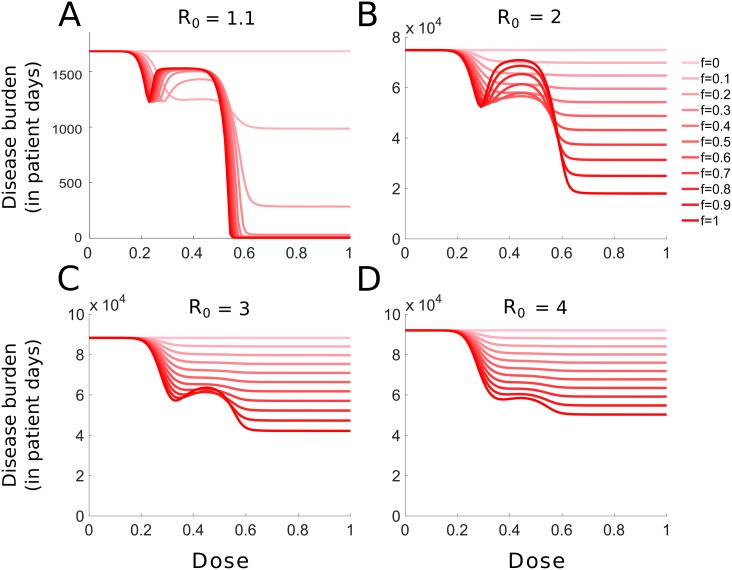
Fig 7. Effect of the treatment coverage on the disease burden.
The disease burden for various fractions f of treated hosts is shown, ranging from no treatment (f = 0, pale red) to full treatment (f = 1, dark red). The basic reproductive number is given by: (A) R0 = 1.1; (B) R0 = 2; (C) R0 = 3; (D) R0 = 4. Note that the scale on the y-axis in panel A is very different from the other panels.

