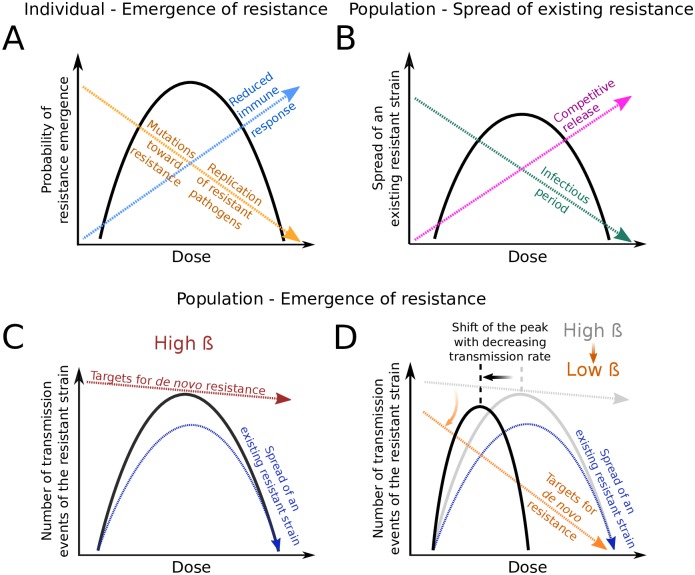
Fig 8. Risk of resistance and the factors shaping it at the individual and population levels.
(A) The within-host probability of resistance emergence (solid black line) is shaped by three forces that are in part inversely affected by the drug dose: the strength of the immune response triggered by the sensitive strain (dashed blue arrow), the mutations of sensitive-to-treatment pathogens towards resistance during treatment (dashed orange arrow) and the rate of clearance of the resistant strain through the drug (dashed orange arrow as well). This panel is based on Figure 1 from Kouyos et al. [5] and adapted to represent the scenario we model. (B) The spread of an existing resistant strain in a susceptible population (solid black line) also has an inverted U-shape. Increased drug pressure favors the spread of a resistant strain through competitive release (dashed pink arrow). However, with increasing dose, the infectious period (dashed green arrow) decreases, even for infections with the resistant strain. (C,D) Number of transmission events of the resistant strain, at a high (C) or low (D) transmission coefficient β. This measure (solid black lines) depends on the ability of a resistant strain to spread (dashed dark-blue arrows, see panel B), and on the rate of de novo development of a resistant infection. This latter rate depends on the number of sensitively infected patients (or “targets for de novo resistance”), which in turn depends not only on the drug dose but also on R0. With a large R0, large outbreaks of the sensitive strain guarantee a high probability of appearance of resistance (red dashed line in Fig 8C). In contrast, for low R0, this probability severely decreases with increasing drug dose (dashed orange arrow in Fig 8D). The location of the peak in the number of transmission events of the resistant strain therefore depends on the transmission coefficient of the disease. The black curve is essentially the product of the red (or orange) arrow with the dark-blue arrow. The grey line and arrow in panel D are a repetition of the red arrow and black line in panel C.

