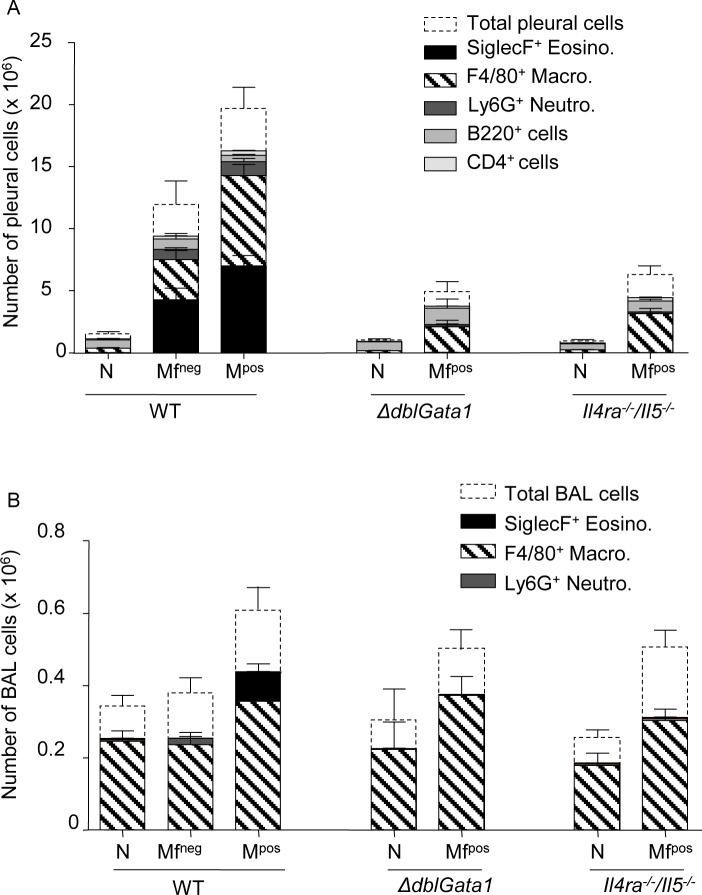
Fig 6. Cells increase in the pleural cavity of infected mice and in the bronchoalveolar space of microfilaremic mice.
Pleural (A) and bronchoalveolar (B) cells were isolated from L. sigmodontis infected WT, ΔdblGata1 and Il-4ra-/-/Il-5-/- BALB/c mice at 70 days p.i. Cell phenotypes (SiglecF+ eosinophils, F4/80+ macrophages, Ly6G+ eosinophils, CD19+ B-cells and CD4+ T-cells) were analyzed by flow cytometry. Results are expressed as mean ± SEM (pool of 2–4 independent experiments for pleural cells; pool of 2–3 independent experiments for bronchoalveolar cells): n = 13–18 WT naive, n = 10–16 WT Mfneg, n = 21–28 WT Mfpos, n = 2 ΔdblGata1 naive, n = 6 ΔdblGata1 Mfpos, n = 6–15 Il-4ra-/-/Il-5-/- naive, n = 17 Il-4ra-/-/Il-5-/- Mfpos.

