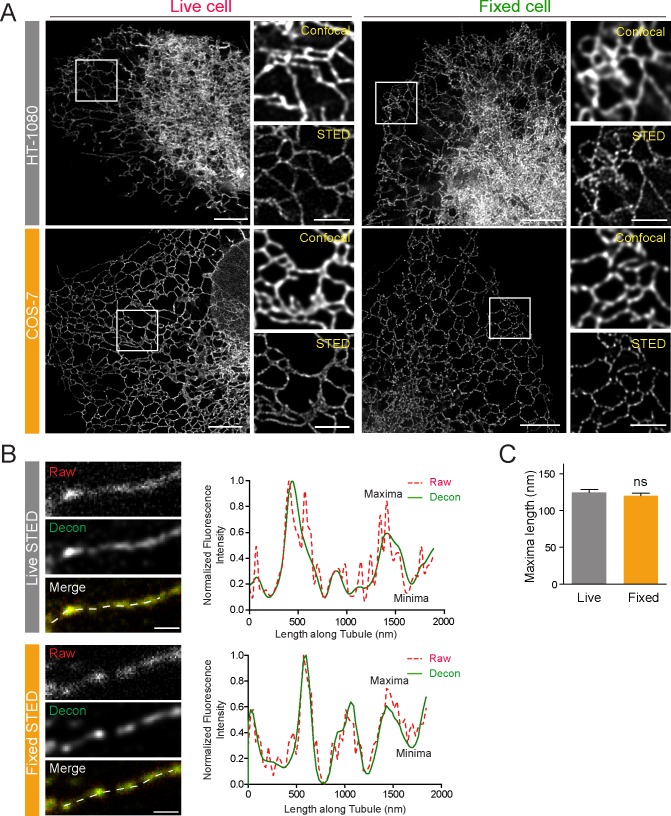
Fig 1. STED imaging reveals lumenal nanodomain periodicity in peripheral ER tubules.
(A) Representative 2D STED images of live and fixed HT-1080 or COS-7 cells expressing ERmoxGFP are shown. Magnified confocal and STED images of the boxed region highlight the improved resolution obtained by 2D STED. Scale bar, 5 μm; zooms, 2 μm. (B) Line scans of isolated peripheral ERmoxGFP-labeled tubules (dashed) from STED images of live and fixed cells show matching maxima and minima for raw (red, dashed) and deconvolved (decon, green, solid) images. Scale bar, 0.5 um. (C) Length of ERmoxGFP maxima/blob was measured in 2D STED images of peripheral ER tubules in live and fixed cells. Values plotted are mean ± SEM from three independent experiments (10–20 line scans/each repeat). Significance assessed by Student t test. Numerical values that underlie the graph are shown in S1 Data. ER, endoplasmic reticulum; ERmoxGFP, ER monomeric oxidizing environment-optimized green fluorescent protein; ns, not significant; STED, stimulated emission depletion; 2D, two-dimensional.

