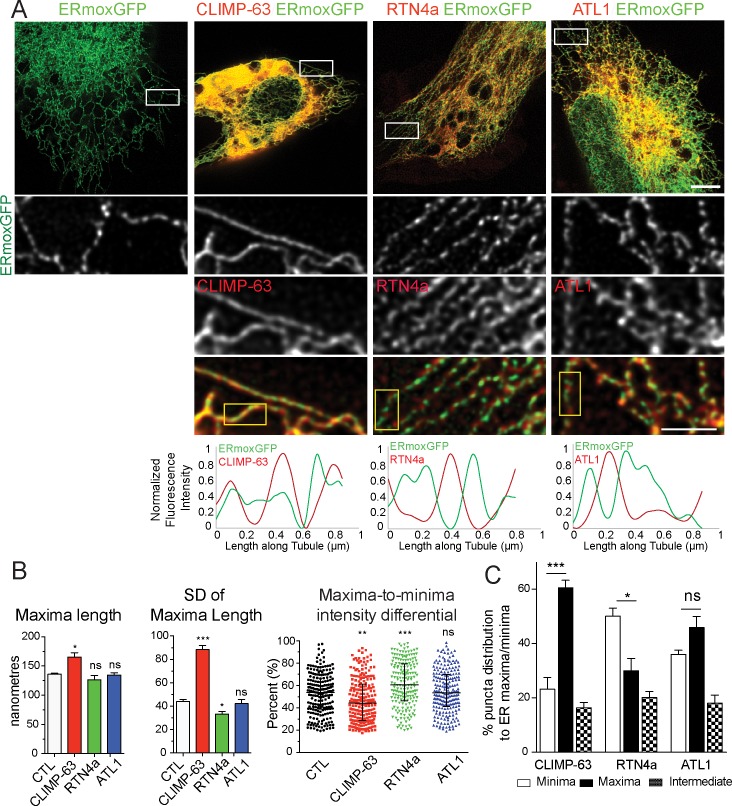
Fig 3. RTN4a and CLIMP-63 overexpression differentially impacts ER nanodomain periodicity.
(A) STED images of ERmoxGFP in HT-1080 cells transfected with ERmoxGFP or cotransfected with mCherry-CLIMP-63 (CLIMP-63), mCherry-RTN4a (RTN4a), or mCherry-ATL1 (ATL1). Peripheral ER regions (white boxes) are shown as zooms; line scans of selected tubules in these regions (yellow boxes) are shown with ERmoxGFP in green and ER-shaping proteins in red. Scale bar, 5 μm; zooms, 2 μm. (B) Peripheral ER tubule maxima length, variation of maxima length (SD), and maxima-to-minima intensity differential are shown for cells transfected with ERmoxGFP alone (CTL) or cotransfected with mCherry-CLIMP-63 (CLIMP-63), mCherry-RTN4a (RTN4a), or mCherry-ATL1 (ATL1). Significance assessed by one-way ANOVA from three independent experiments (40 line scans/each repeat). Bar graphs show mean ± SEM and scatter dot plots median with interquartile range. *P < 0.05; **P < 0.01; ***P < 0.001. Numerical values that underlie the graphs and plots are shown in S1 Data. (C) Based on line scan analysis of peripheral ER tubules of HT-1080 cells cotransfected with mCherry-CLIMP-63 (CLIMP-63), mCherry-RTN4a (RTN4a), or mCherry-ATL1 (ATL1), percent localization of CLIMP-63, RTN4a, and ATL1 puncta to minima or maxima of lumenal ERmoxGFP-labeled tubules was quantified. Significance assessed by one-way ANOVA from four independent experiments (40 line scans/each repeat). Bar graphs show mean ± SEM. *P < 0.05; ***P < 0.001. Numerical values that underlie the graphs are shown in S1 Data. ATL, atlastin; CLIMP-63, cytoskeleton-linking membrane protein 63; CTL, control ER, endoplasmic reticulum; ERmoxGFP, ER monomeric oxidizing environment-optimized green fluorescent protein; ns, not significant; RTN4a, reticulon4a; SD, standard deviation; STED, stimulated emission depletion.

