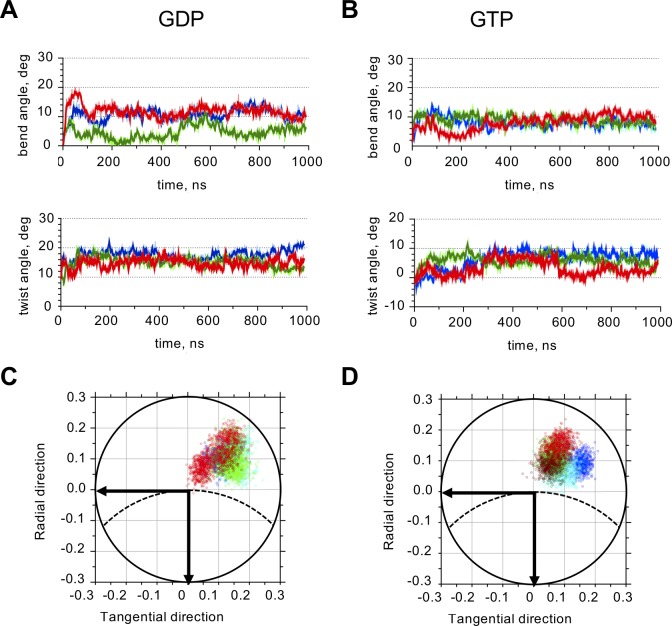
Fig 3. Quantitative analysis of intra-dimer interface of GTP- and GDP-tubulin tetramers.
A: Time-dependence of GDP-tubulin intra-dimer bend and twist angles. Colors mark independent simulation runs. Only one of the two intra-dimer interfaces for each tetramer simulation run is shown. B: Time-dependence of GTP-tubulin intra-dimer bend and twist angles. Colors mark independent simulation runs. C: Projections of the unit OZ-vector of the β-subunit of GDP-tubulin dimer onto the xy-plane of the α-tubulin at every ns after the first 500 ns of the simulation. Data and color-coding correspond to panel A. Dashed line schematically shows the circumference of the microtubule. Horizontal axis is tangential to the microtubule, vertical axis is directed radially toward microtubule axis. D: Projections of the unit OZ-vector of the β-subunit of GTP-tubulin dimer onto xy-plane of the α-tubulin at every ns after the first 500 ns of the simulation. Data and color-coding correspond to panel B.

