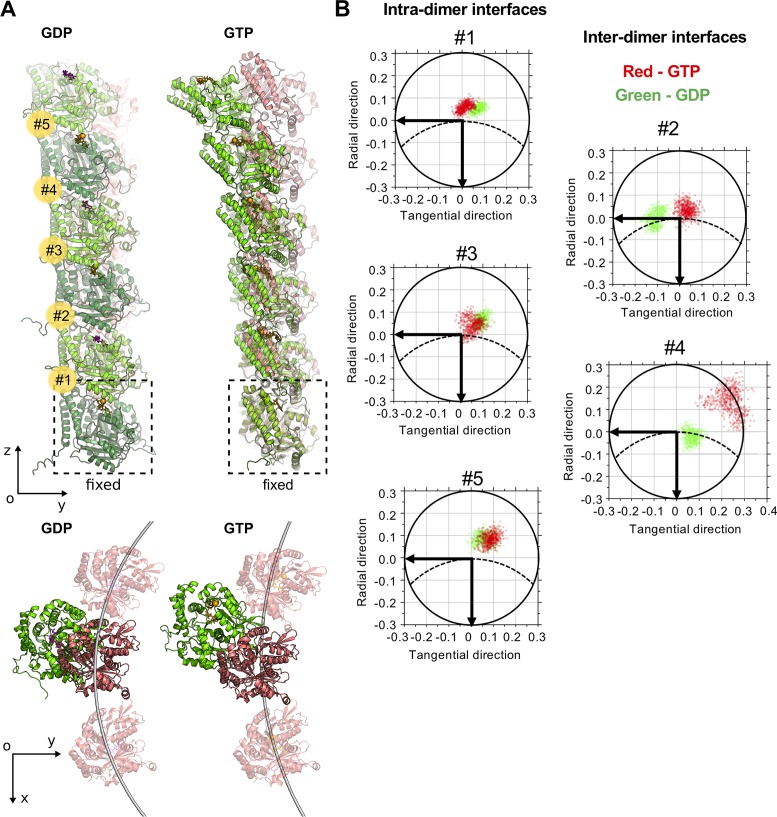
Fig 5. Effects of attachment to mechanical support on tubulin oligomer conformation.
A: GDP- and GTP-tubulin hexamers at the end of 1 μs simulation (green) aligned onto initial straight structures (pink), viewed from the side and from top. GTP molecule and Mg2+ ion are shown in orange, GDP molecule is purple. Five inter-tubulin interfaces are numbered from bottom to top (in yellow circles). B: Projections of the unit OZ-vector of the upper tubulin subunit at each tubulin interface onto xy-plane of the lower tubulin at every nanosecond of the simulation after the first 500 ns. Dashed line schematically shows the circumference of the microtubule. Horizontal axis is tangential to the microtubule, vertical axis is directed radially toward microtubule axis. Green and red data points correspond to GDP- and GTP-tubulin data, respectively. Interfaces are numbered as in panel A.

