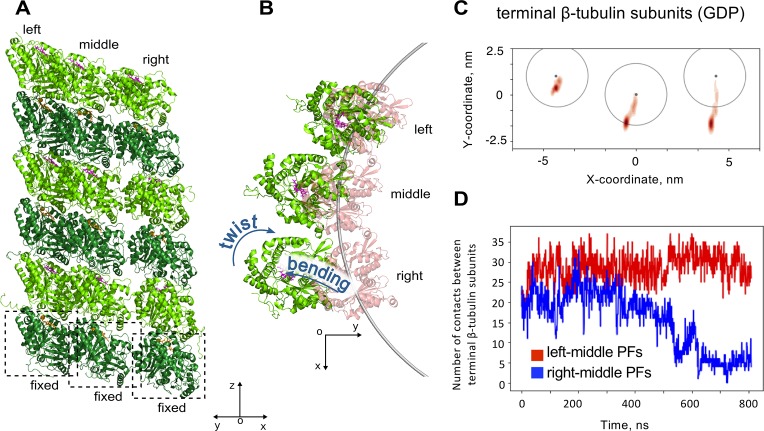
Fig 6. Effects of lateral protofilament neighbors on tubulin oligomer relaxation from straight conformation.
A: three GDP-tubulin hexamers after 0.8 μs simulation, viewed in diagonal direction. B: the same structure as in panel A, viewed from top. C: Smoothed projections of the centers of mass of terminal β-tubulin subunits onto XY plane of microtubule-bound coordinate system. D: Number of contacts between Cα-atoms of the terminal β-tubulin subunits during one the simulation run. Red curve corresponds to contacts between the left and the middle protofilaments, blue curve is for contacts between the middle and the right protofilaments.

